





A martech stack audit is a structured review of every marketing tool you pay for: who uses it, what it costs per active user, what it overlaps with, how well it connects and who owns the data. It ends with a decision for each tool: keep, consolidate, replace or retire, timed to contract renewal dates.
Key Takeaways
- Gartner's 2025 Marketing Technology Survey found only 49% of martech tools are actively used. Half the stack is a budget line, not a capability.
- Marketing budgets are flat at 7.8% of revenue in 2026 while AI takes 15.3% of them, so new AI spend has to come from somewhere. The stack is the easiest place to find it.
- Audit eight things per tool: inventory, active usage, overlap, cost per active user, integration debt, data ownership, AI readiness and contract dates.
- Score each tool out of 100, then place it on a value versus uniqueness grid to decide whether to keep, consolidate, replace or retire it.
- In our illustrative nine-tool example, retiring two tools and folding five into one platform cuts the run-rate by 36.8% from year two.
- Six weeks is enough for a mid-size team, if finance and marketing operations own it together.
This guide is written for CMOs, CFOs and marketing operations leads who need a defensible number before the next budget cycle. I run finance at Cyberdunes, where we build Apex®, the AI-native digital experience platform (DXP). We sell one of the platforms you might consolidate into, so we have kept the method vendor-neutral and labeled every illustrative number as illustrative.
Why Audit Your Martech Stack Now?
Because utilization is low, budgets are flat and AI spending is rising inside the same envelope. A martech stack audit is how you fund AI without asking for a bigger budget.
- Half the stack sits idle. Gartner's 2025 Marketing Technology Survey reports that "only 49% of tools are actively used," and just 15% of organizations qualify as high performers that meet strategic goals with positive ROI (Gartner). Earlier Gartner readings put capability utilization at 58% in 2020 and 42% in 2022 (Gartner, May 2023), and a later Gartner Marketing Technology Survey found teams using just 33% of their martech capability (Gartner). The surveys measure slightly different things, so read the trend loosely. The conclusion does not change: you are paying for a lot you do not use.
- Budgets are flat. Gartner's 2026 CMO Spend Survey of 401 marketing leaders found budgets at 7.8% of company revenue, up from 7.7% in 2025, and 56% of CMOs say they lack the budget to deliver their 2026 strategy (Gartner, May 2026). Gartner adds that 7.8% is 18% below the mean of four years earlier (Gartner).
- AI is claiming a growing share. CMOs allocate an average of 15.3% of marketing budgets to AI, and the 30% of organizations with mature AI readiness allocate 21.3% (Gartner, May 2026).
- Pricing is getting harder to predict. Gartner warns that consumption-based martech pricing is expanding and brings "cost volatility and operational strain," and advises CMOs to monitor usage, renegotiate contracts and add controls (Gartner).
- The vendor market is churning. Chiefmartec's 2026 martech map counts 15,505 products, up just 0.79% from 15,384 in 2025, with 1,488 added and 1,367 removed in a year (Chiefmartec, May 2026). Some of the tools you rely on will be acquired, bundled or shut down.
For context, technology was already a quarter of the marketing budget before the AI wave: Gartner reported martech at 25.4% of 2023 budgets (Gartner, May 2023). For budget levers beyond the stack, see our five ways to save on your marketing budget.
What Does a Martech Stack Audit Cover?
A useful audit covers eight dimensions per tool, and each produces evidence a CFO can check. Gartner's own advice is to "compare costs to utilization data to identify tools with low adoption or redundant capabilities" and to audit your internal ecosystem before evaluating new vendors (Gartner).
| Dimension | Question it answers | Evidence to collect | Owner |
|---|---|---|---|
| Inventory | What do we pay for? | Accounts payable, card statements, SSO app list | Finance |
| Usage | Who actually uses it? | 30-day active users from admin logs | Marketing ops |
| Overlap | What else does the same job? | Capability map across tools | Marketing ops |
| Cost per active user | Is it worth the money? | Annual cost divided by active users | Finance |
| Integration debt | What breaks if we change it? | Connectors, scripts, manual exports, upkeep hours | IT |
| Data ownership | Can we leave with our data? | A test export; where the master record lives | IT |
| AI readiness | Will it work with AI agents? | API or MCP access, AI usage pricing | IT |
| Contract dates | When can we act? | Renewal date, notice period, auto-renew terms | Procurement |
How Do You Run a Martech Stack Audit, Step by Step?
Work through the eight dimensions in order, because each one feeds the next. Usage without inventory misses shadow tools, and decisions without contract dates arrive a month after the auto-renewal.
1. Build the Inventory From Money, Not Memory
Start with what finance paid in the last 12 months, not with what marketing remembers buying. Pull every vendor from accounts payable and corporate card statements, then add the single sign-on app list and any browser extensions with paid tiers. Name one business owner per tool. Tools nobody will own are your first retirement candidates.
2. Measure Active Usage
Count users who logged in or ran a meaningful action in the last 30 days, from each tool's admin console. Compare that with paid seats. Seats, not logins, drive most invoices, so a tool with 25 seats and 6 active users is a pricing problem even if those 6 love it.
3. Map Overlap
List the capabilities each team actually uses, not the ones on the vendor's feature page, and mark where two or more tools do the same job. Common overlaps we see: rank tracking inside an SEO suite and in a separate tracker, asset storage in a DAM and in the CMS media library, and email in both a marketing automation tool and a newsletter tool.
4. Calculate Cost per Active User
Divide the fully loaded annual cost (license, usage fees, paid add-ons, agency or admin time) by active users. This one number does more to change minds in a budget meeting than any feature comparison. For usage-priced tools, use the last 12 months of actual invoices, not the contract minimum.
5. Count Integration Debt
For each tool, count the connectors, custom scripts and manual CSV exports that keep it talking to the rest of the stack, and estimate the hours per month spent fixing them. Integration debt is the hidden cost Gartner points to when it lists support, time, user adoption, implementation and migration as part of a tool's true cost (Gartner).
6. Test Data Ownership
Run a full export from every tool you might leave, and check the result opens cleanly. Note where the master record for each data type lives: contacts in the CRM, content in the CMS, assets in the DAM. A tool that holds your only copy of something is expensive to leave, whatever its score.
7. Check AI Readiness
Ask whether AI assistants and agents can read from and write to the tool through an open API or the Model Context Protocol (MCP), and how the vendor prices AI usage. This matters more each quarter: in a Gartner survey of 413 martech leaders, 45% of those with AI agents in pilot or production said vendor-offered agents do not meet their performance expectations, and half said their technical and data stack is not ready for agents (Gartner, October 2025). Our guide to MCP for marketing teams explains what to ask vendors.
8. Build the Contract Calendar
Record each renewal date, notice period and auto-renewal clause in one sheet sorted by notice deadline. A 90-day notice period on an annual contract means the real decision date is three months before renewal. Miss it and the saving moves a year out.
How Do You Score Each Tool?
Give every tool a score out of 100 across eight weighted criteria, so the conversation moves from opinions to evidence. Weight usage and outcome highest, because an unused tool has no value however good its features are.
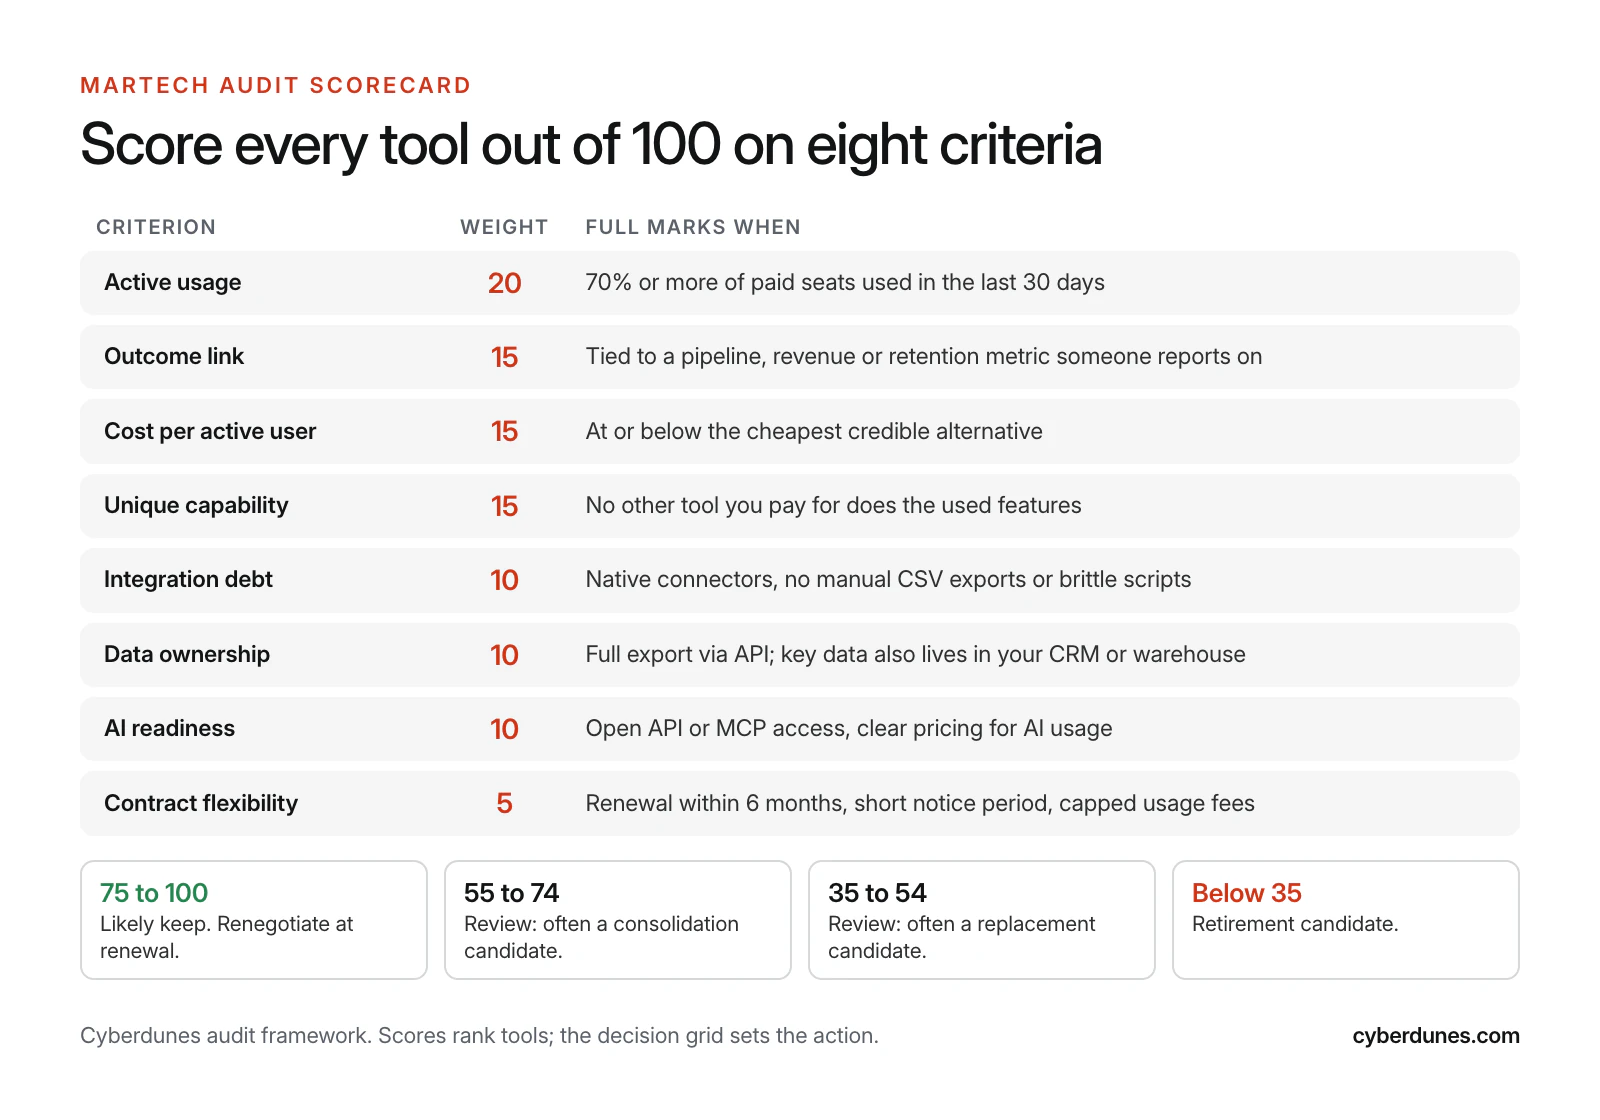
Score each criterion as full marks, half marks or zero. For example, a tool with 50% of seats active earns 10 of 20 for usage, and one with no metric anyone reports on earns zero for outcome link. Two people should score each tool independently, then agree. Disagreement usually means the evidence is missing, not that the scorers differ.
The score ranks tools. It does not decide on its own, because a low-scoring tool that holds your only customer data may still need a careful replacement rather than a quick cancellation.
Should You Keep, Consolidate, Replace or Retire Each Tool?
Place each tool on two axes, value delivered and unique capability, and the action follows. Value comes from the usage and outcome scores; uniqueness comes from the overlap map.
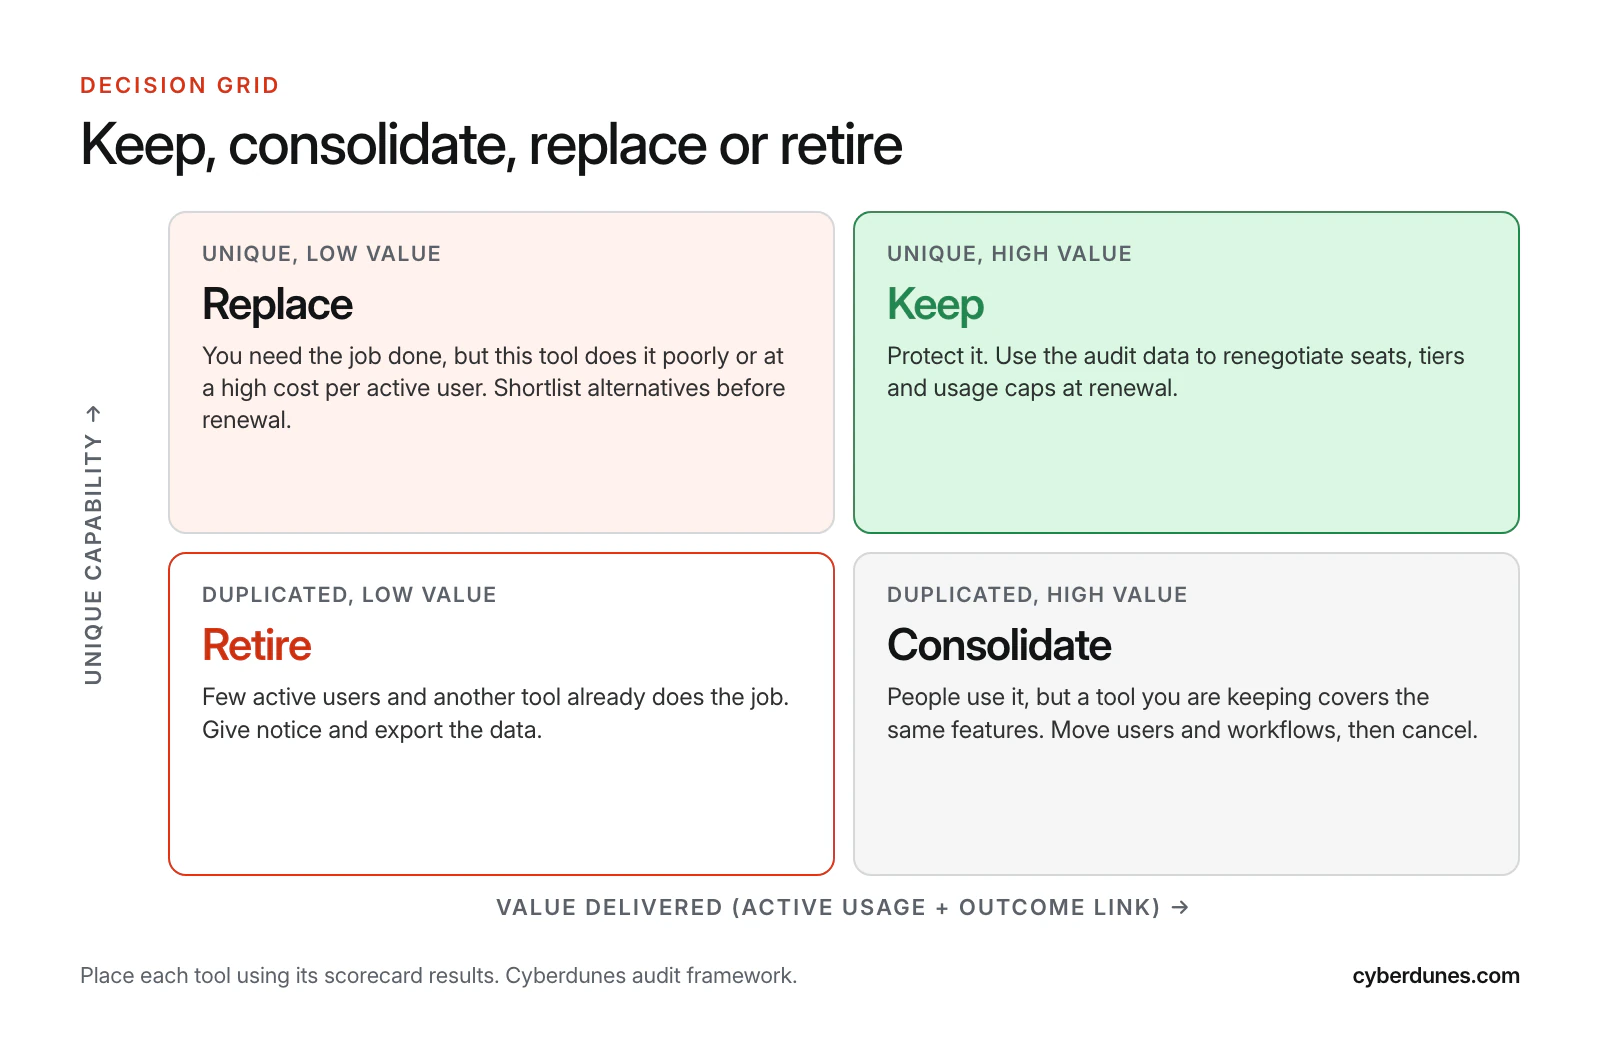
| Decision | Typical evidence | Next action |
|---|---|---|
| Keep | High usage, tied to a reported metric, no overlap | Renegotiate seats, tiers and usage caps at renewal |
| Consolidate | Used, but a tool you are keeping covers the same features | Move users and workflows, then give notice |
| Replace | Capability is needed, but cost, integration or data access is poor | Shortlist two alternatives, pilot before the notice date |
| Retire | Few active users and the job is done elsewhere or not needed | Export data, give notice, remove access |
What Can a Martech Stack Audit Save? A Worked Example
In the illustrative example below, a mid-size company spends $132,600 a year on nine tools with 86 paid seats and 39 active users. The audit returns $48,800 a year from year two. The numbers are invented to show the method, not taken from a client.
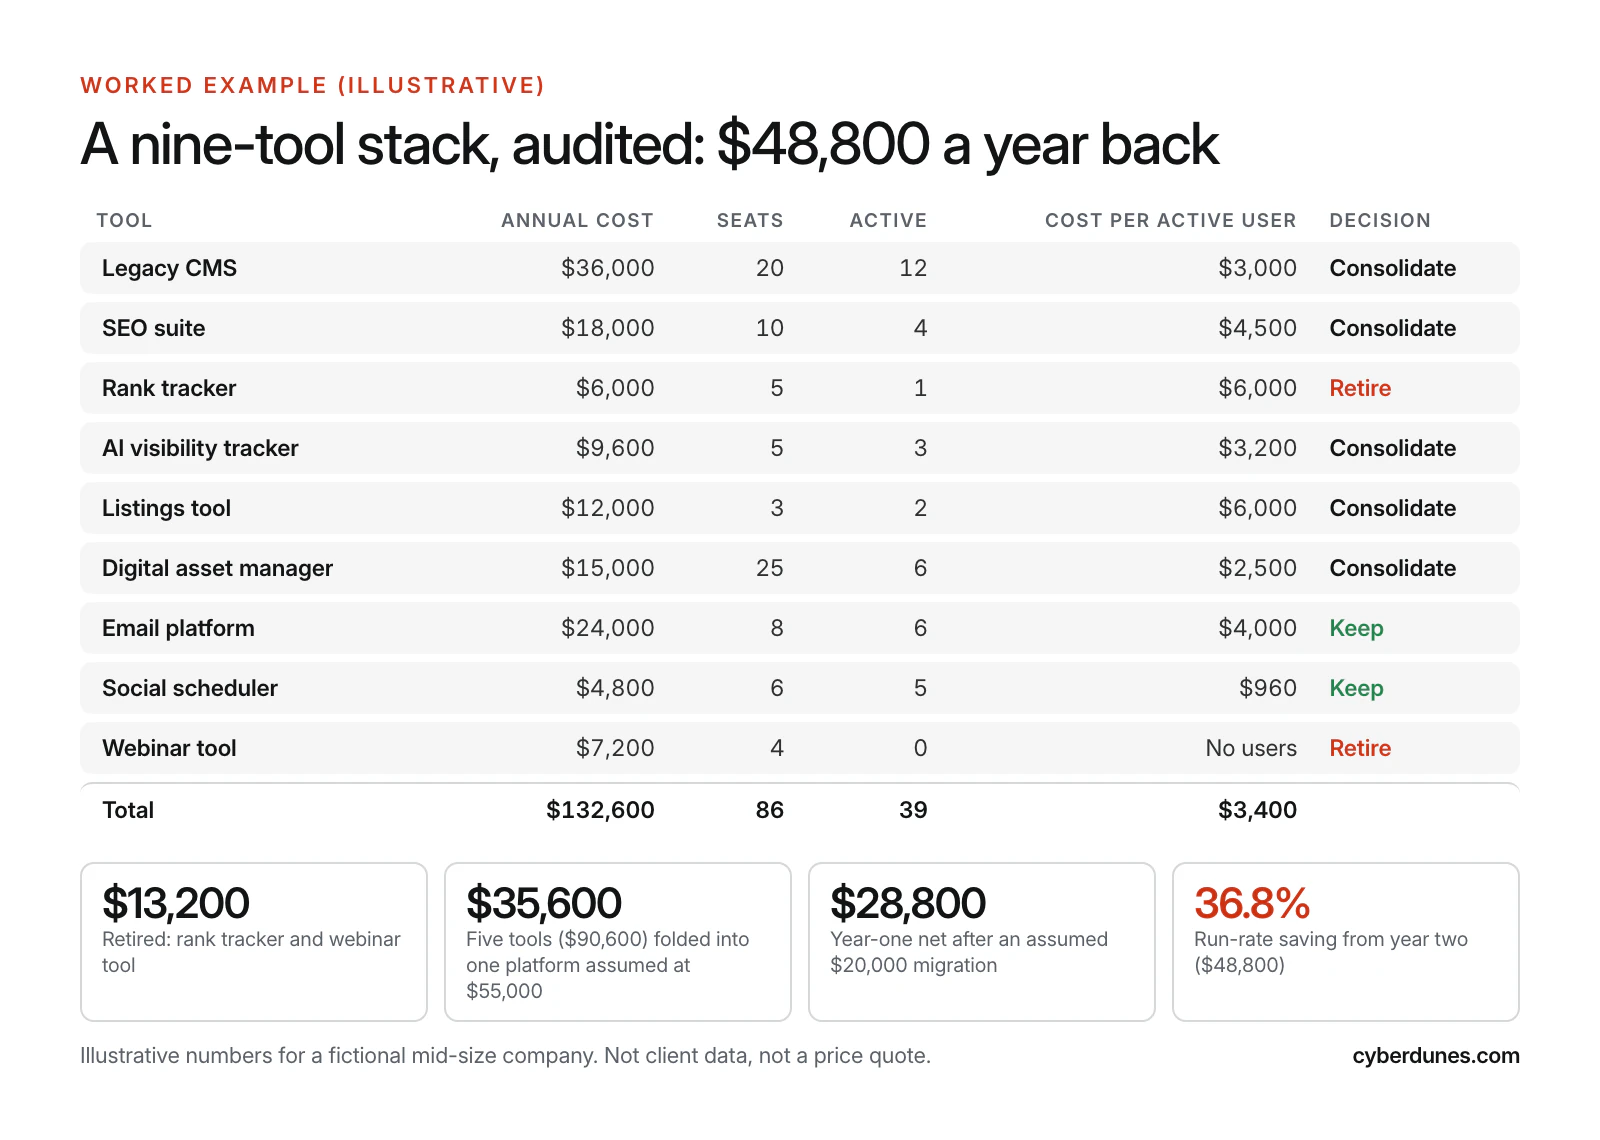
- Retire two tools. The rank tracker ($6,000, one active user) duplicates the SEO suite, and the webinar tool ($7,200) had no active users. Saving: $13,200 a year.
- Consolidate five tools. The legacy CMS, SEO suite, AI visibility tracker, listings tool and digital asset manager cost $90,600 together. A single platform covering those jobs is assumed at $55,000 a year. Saving: $35,600 a year.
- Pay for the move. Migration, redirects and training are assumed at $20,000 one-time. Year-one net saving: $13,200 + $35,600 − $20,000 = $28,800.
- Run-rate from year two. $48,800 a year, or 36.8% of the original $132,600.
Two cautions keep the case honest. First, include a productivity dip of a few weeks after any migration in your plan, even if you do not put a number on it. Second, the email platform stays: it scored well, and moving sender reputation is a risk this example does not need to take. Not every overlap is worth removing.
What Does a Lean Martech Stack Look Like in 2026?
A lean 2026 martech stack has one system of record per data type and as few tools as the team can run well. The examples below are starting points from our practice, not benchmarks.
| Layer | Small business | Mid-size company | Enterprise |
|---|---|---|---|
| Customer data | CRM | CRM | CRM plus customer data platform |
| Content and web | All-in-one DXP or CMS | DXP with built-in SEO and DAM | DXP, enterprise DAM, translation |
| Search and AI visibility | Inside the DXP | Inside the DXP or one SEO suite | SEO suite plus AI visibility tracking |
| Email and automation | Inside the DXP or one email tool | Email or automation platform | Marketing automation platform |
| Analytics | Google Analytics | Google Analytics plus dashboards | Warehouse, BI and marketing mix modeling |
| Ads and social | Native ad managers | Native managers plus a scheduler | Ad platforms, social suite |
Enterprises measuring channel impact across a larger stack can go further with marketing mix modeling. Smaller teams should read our breakdown of DXP costs for small businesses before adding anything.
When Does Martech Consolidation Into One Platform Make Sense?
Consolidation into one platform makes sense when several tools serve the same team, share the same data and duplicate each other, and the team values one login over best-of-breed depth. It makes less sense when a specialist tool gives a measurable edge you would lose.
- Consolidate when content, SEO, assets and listings are run by the same few people, integrations between those tools break often, and cost per active user is high because seats sit idle.
- Stay composable when you have engineers to maintain integrations, separate teams own each tool, or one tool is a source of competitive advantage. Our comparison of composable and all-in-one DXPs covers the trade-off in depth.
- Watch the pricing model. As vendors move toward usage and outcome-based pricing, cap your exposure in the contract. Our guide to outcome-based pricing explains what to negotiate.
One option is Apex®. It brings publishing, SEO, AI visibility tracking, local listings, digital asset management and email newsletters into one platform, and connects to your CRM, ERP, marketing automation, Google Analytics, ecommerce and payment systems through its API layer. It is not a CRM or an ad platform, so it replaces the content-side tools, not the whole stack. See what Apex® includes, or compare it with other options in our enterprise DXP buying guide.
A Six-Week Martech Audit Plan
A mid-size team can complete the audit in six weeks with about a day a week from finance, marketing operations and IT. Migrations then follow the contract calendar, not the audit calendar.
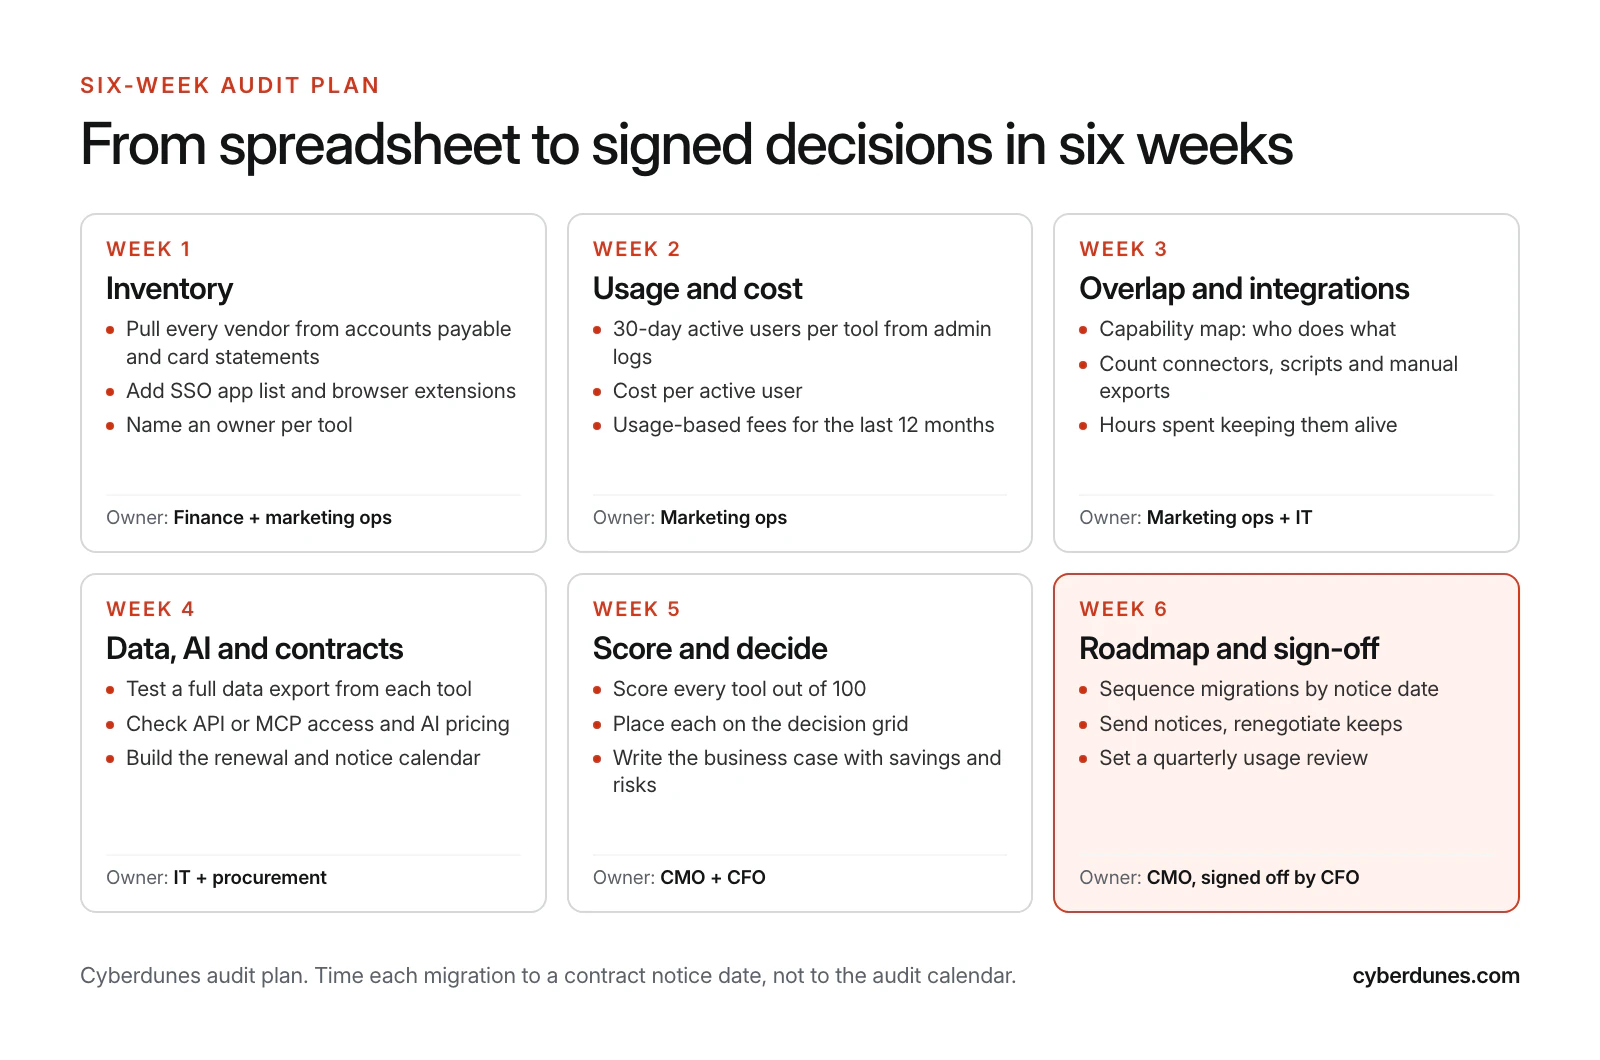
- Week 1, inventory (finance and marketing ops). Vendor list from payables and cards, SSO apps, one owner per tool.
- Week 2, usage and cost (marketing ops). 30-day active users, cost per active user, 12 months of usage fees.
- Week 3, overlap and integrations (marketing ops and IT). Capability map, connector count, upkeep hours.
- Week 4, data, AI and contracts (IT and procurement). Test exports, API and MCP checks, renewal and notice calendar.
- Week 5, score and decide (CMO and CFO). Scorecard, decision grid, business case with savings and risks.
- Week 6, roadmap and sign-off (CMO, approved by CFO). Migration sequence by notice date, notices sent, renegotiations booked, quarterly usage review scheduled.
What Mistakes Derail a Martech Audit?
Most audits fail on timing and ownership, not analysis. These are the failure modes to plan around.
- Missing the notice date. The audit finishes after the auto-renewal, and the saving slips a year.
- Counting licenses, not people. Seat counts look healthy until you check who logged in.
- Ignoring the migration cost. A business case without migration, training and a productivity dip will be rejected by finance, and should be.
- Replacing a tool before fixing the process. Gartner's 2026 survey warns that CMOs risk investing in AI tools "faster than they build the data foundations, processes, governance and talent required to scale them" (Gartner). The same applies to any new platform.
- Running it once. Without a quarterly usage review, the stack regrows within a year. AI tools bought by individual teams, the subject of our guide to AI agents for marketing, are the fastest-growing source of new sprawl.
How Cyberdunes and Apex® Help With Martech Consolidation
If your audit shows the content side of your stack (CMS, SEO tools, AI visibility tracking, listings, asset storage and newsletters) is where overlap and idle seats cluster, Apex® can bring those jobs into one platform. It includes a WYSIWYG editor with an AI writing assistant, publishing to web, email, social and chatbots, XML sitemaps, Schema.org JSON-LD, redirects, Google Search Console integration, AI visibility tracking across ChatGPT, Gemini, Claude, Perplexity and Google AI Overviews, local listings management and digital asset management. Plans are custom-quoted, so we can model your own audit numbers rather than a list price.
We will also tell you when consolidation is the wrong call. If a specialist tool scores well and holds data you cannot move cleanly, keep it and integrate it.
Book a demo and bring your audit sheet
Sources
- Marketing Technology: 2025 Gartner Marketing Technology Survey Findings (Gartner, accessed October 2026)
- Marketing Technology and Communications Excellence (Gartner, accessed October 2026)
- Gartner Survey Reveals 71% of CMOs Believe They Lack Sufficient Budget to Fully Execute Their Strategy in 2023 (Gartner, May 2023)
- Gartner 2026 CMO Spend Survey Finds CMOs Allocate 15.3% of Marketing Budgets to AI (Gartner, May 2026)
- CMO Spend 2026 (Gartner, 2026)
- Gartner Survey Finds 45% of Martech Leaders Say Vendor-Offered AI Agents Fail to Meet Expectations (Gartner, October 2025)
- 2026 Marketing Technology Landscape Supergraphic (Chiefmartec, May 2026)