





Marketing mix modeling (MMM) is a statistical method that estimates how much each marketing channel adds to sales. It uses weekly spend, sales and outside factors such as price and seasonality, not user-level tracking. The output is each channel's return on investment (ROI) and a recommended budget split. Google's open-source Meridian has made it far cheaper to run.
Key Takeaways
- MMM works from totals, not people. App tracking consent, cookie choices and the walled gardens' own reporting do not weaken it the way they weaken click-based attribution.
- Google's Meridian became available to all marketers on January 29, 2025. It is free and open source, and Google says it cannot see your data. Meta's Robyn is the main open-source alternative.
- Meridian's documentation calls for at least two years of weekly data for a model by region and three years for a national model.
- MMM is strongest when lift experiments calibrate it. Use attribution for daily optimization, experiments to establish what is causal, and MMM for the quarterly budget split.
- The decision that matters is marginal ROI: what the next rupee returns in each channel. Our illustrative example gains 3.3% in modeled revenue by moving money, with no extra spend.
This guide is for CMOs, founders and finance leaders deciding whether MMM is worth a quarter of their analytics team's time. Our finance team at Cyberdunes reviews marketing spend the way a CFO would, and our analytics practice sets up the tracking these models rely on. We will tell you when MMM pays back and when a simpler method does the job.
What Is Marketing Mix Modeling?
Marketing mix modeling is a regression model that explains a business result, such as weekly sales, using marketing spend by channel plus factors outside marketing. It separates the sales you would have had anyway (the baseline) from the sales each channel added.
Google's Meridian documentation sums up the three questions an MMM answers:
- What is the historical ROI and contribution of each marketing channel?
- What is the response curve for each channel, meaning how results change as spend changes?
- How should we allocate the next budget to get the most out of it?
"Media mix modeling" means the same thing. Some teams use "media" when the model covers only paid media and "marketing" when it also includes price, promotions and distribution.
Why Is Marketing Mix Modeling Back?
MMM is back because click-level tracking now sees less of the buyer journey every year, and MMM never depended on it. Consumer goods brands have used it for decades. What has changed is that digital-first brands now need it too.
- App tracking needs consent. On iOS 14.5 and later, Apple requires apps to get permission through App Tracking Transparency before they track users or read the advertising identifier. Without permission, "the device's advertising identifier value will be all zeros."
- Cookies did not disappear, but choice stayed. On April 22, 2025, Google said Chrome "will not be rolling out a new standalone prompt for third-party cookies". Users still choose in Chrome's settings. Click-level tracking stays partial, not dead.
- Attribution models got narrower. Google Analytics 4 retired first click, linear, time decay and position-based models. Its help page says they "are no longer available as of November 2023."
- Walled gardens grade their own work. Each ad platform reports conversions with its own rules, so channel reports add up to more than your actual sales.
- AI answers send fewer clicks. Buyers who read about you in an AI answer often never click, which is why we track AI visibility alongside visits. Our guides to tracking AI traffic in GA4 and planning for zero-click search cover what analytics can still see.
MMM works from weekly totals, so none of these gaps break it. It also uses no personal data, which keeps your privacy review simpler. If you sell in India, plan your consent changes alongside it; see our briefing on DPDP consent managers and the deadline.
How Does Marketing Mix Modeling Work?
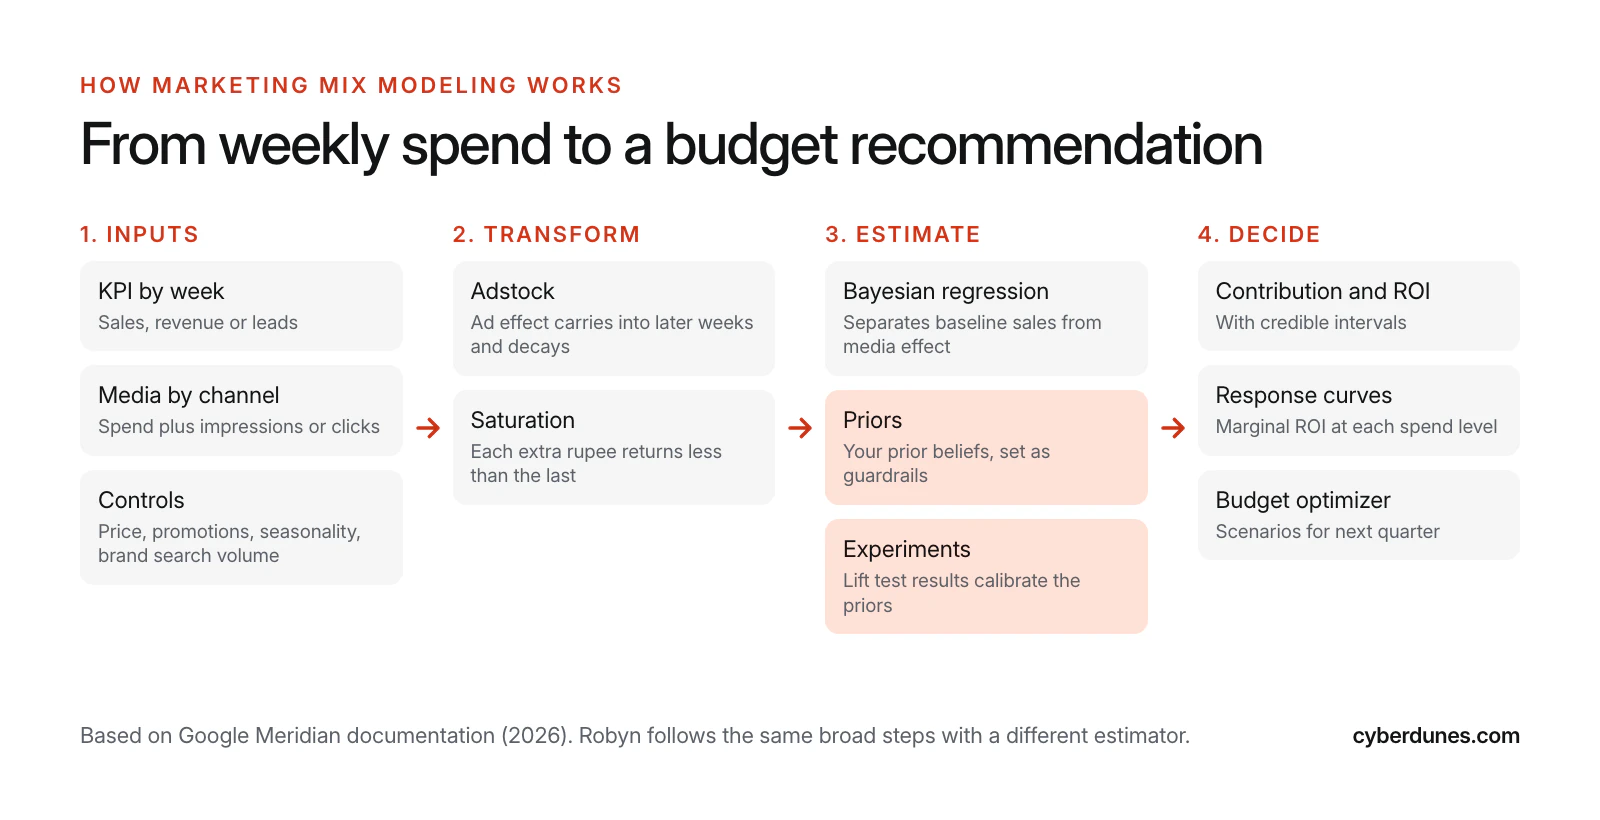
An MMM changes each channel's spend in two ways that match how advertising behaves, then fits a regression that splits sales into baseline and media effects. Bayesian MMMs such as Meridian also let you feed in what you already know.
Adstock: Ads Keep Working After They Stop
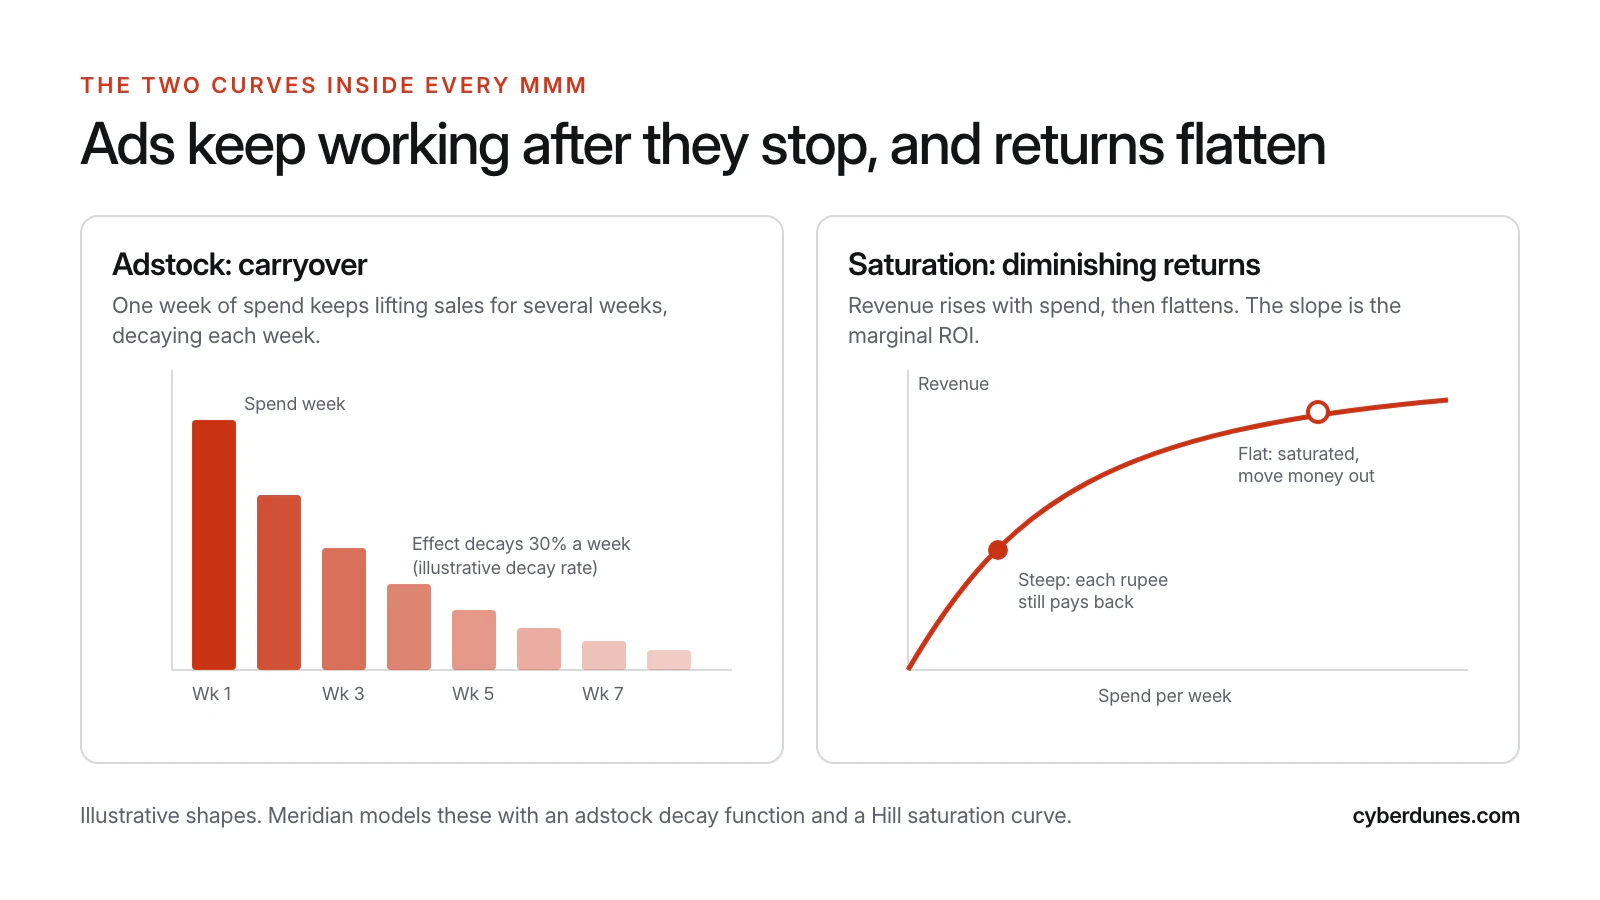
A TV or YouTube burst keeps lifting sales for weeks. Adstock models that carryover as a weighted average of current and past weeks' media, with weights that decay over time. Meridian's documentation describes it as an effect "that tapers off slowly over time" and offers geometric and binomial decay shapes.
Saturation: Each Extra Rupee Returns Less
Double your search budget and you will not double search sales. Meridian models this with a Hill curve, where a "half saturation point" marks the spend that reaches half the maximum effect. The docs warn that the curve is estimated from the spend levels you have actually run, so read predictions far outside that range "with an appropriate level of caution."
Bayesian Priors and Calibration With Experiments
A prior is your starting belief about a channel's ROI, which the data then updates. Meridian's calibration guide calls a calibrated prior a "guardrail." Without one, "the model might estimate that a channel with low spend is driving massive revenue." The strongest basis for a prior is an incrementality experiment, such as a geo lift test. That is a test where you change spend in some regions and hold it steady in others, then compare sales. Meridian's CalibrationBuilder turns these results into ROI priors, and Google's Meridian site now lists Meridian GeoX for running geo experiments to calibrate the model.
Google Meridian vs Meta Robyn
Both are free and open source, and both model adstock and saturation. Choose Meridian if you want Bayesian priors, regional models and YouTube reach and frequency. Choose Robyn if your team works in R and wants semi-automated model selection.
Google announced on January 29, 2025 that Meridian was available to all marketers and data scientists. The announcement said it had been tested with hundreds of brands and had a partner program of "over 20 measurement partners trained and certified." Meta describes Robyn as "an experimental, semi-automated and open-sourced Marketing Mix Modeling (MMM) package from Meta Marketing Science." Its documentation says it "implements the MMM calibration as an objective function in the multi-objective optimization."
| Criterion | Google Meridian | Meta Robyn |
|---|---|---|
| Method | Bayesian causal inference with priors | Ridge regression with evolutionary hyperparameter search |
| Language | Python | R; Python version in beta |
| Regional data | Google recommends a model by region "when possible" | Docs do not describe regional modeling |
| Experiment calibration | Experiment results set as ROI priors; GeoX for geo tests | Experiment results added as an objective in its multi-objective optimization |
| Reach and frequency | Supported as model inputs | Beta curve calibrator uses reach and frequency |
| Planning interface | Scenario Planner report from a trained model | Budget allocator in code |
| Data privacy | Google says it has no access to your inputs or results | Runs on your own machines |
| Best fit | Brands with regional sales data and video spend | Digital-heavy brands with R skills |
On data privacy, Meridian's Faq says "Google won't have access to your input data, model, or results," apart from data you request from its MMM Data Platform. That platform supplies Google Query Volume, an indexed measure of brand and category search demand, which Meridian recommends as a control variable.
What Data Do You Need for MMM?
You need two to three years of weekly sales and media data by channel, plus the outside factors that also move sales. Meridian's data guide says that "historical data should be a minimum of two years' worth of weekly data for geo-level models and three years' of data for national-level models."
| Field | Grain | Typical source | Required? | Watch out for |
|---|---|---|---|---|
| KPI: revenue, orders or qualified leads | Weekly, by region | ERP, ecommerce platform, CRM | Yes | Returns and cancellations; use one definition throughout |
| Media spend by channel | Weekly, by region | Ad platforms, agency invoices | Yes | Spend booked by invoice date instead of by when the ads ran |
| Impressions or clicks by channel | Weekly, by region | Ad platforms, TV and print schedules | Yes (spend can stand in) | Mixed definitions across platforms |
| Price and promotions | Weekly | Pricing team, ecommerce | Strongly advised | Discounts that coincide with ad bursts |
| Seasonality and events | Weekly | Calendar: Diwali, sale events, holidays | Strongly advised | Festivals whose dates move each year |
| Brand search volume | Weekly, by region | Google MMM Data Platform | Optional | Treat it as a control, not a channel |
| Population by region | Static | Census or internal | For regional models | Region definitions that changed over time |
| Lift test results | Per test | Geo tests, platform lift studies | Recommended | Tests run long before the modeled period |
Sample size matters more than most teams expect. Meridian's guidance on data volume works through an example of two years of weekly national data: 104 points for 26 parameters, or about four per parameter. It concludes: "This sample size is too low to estimate the model reliably." The fix is more regions, more history or fewer channels, not a smarter algorithm.
MMM vs Attribution vs Incrementality Testing
They answer different questions, so mature teams use all three. Multi-touch attribution (MTA) assigns credit to tracked touchpoints. Incrementality tests measure causal lift for one channel at a time. MMM sets the budget split across all channels, including offline ones.
| Criterion | Attribution (MTA, last click) | Incrementality test | Marketing mix modeling |
|---|---|---|---|
| Question answered | Which tracked touch preceded the sale? | Did this channel cause extra sales? | How should the total budget be split? |
| Data | User-level clicks and views | Test vs control regions or users | Weekly totals |
| Covers offline media | No | Yes, with geo tests | Yes |
| Affected by consent and tracking loss | Heavily | Lightly | Barely |
| Speed | Daily | 4 to 8 weeks per test | Quarterly refresh |
| Best use | Bids, creatives, keywords | Validate a big channel; calibrate MMM | Annual and quarterly budget allocation |
If you already run website experiments, the logic of an incrementality test will feel familiar: it is an A/B test run on regions or audiences instead of page versions. The common mistake is to use attribution for budget allocation. Last click rewards the channels nearest the purchase, such as branded search and retargeting, and undervalues the ones that create demand.
Should a Mid-Size Brand Do Marketing Mix Modeling?
Do it if you spend across four or more channels, including some you cannot track by click, and have two years of clean weekly data. Skip it for now if almost all your spend goes to one or two tracked digital channels; a lift test will tell you more for less.
MMM Readiness Checklist
| Check | Pass condition | Owner | Effort to fix |
|---|---|---|---|
| History | 2+ years weekly, or 3+ years if national only | Analytics lead | Cannot be shortcut |
| Channel mix | 4+ channels with real spend changes over time | CMO | Plan spend variation |
| Spend data | Spend by channel by week, reconciled to finance | Finance | 2 to 4 weeks |
| One KPI definition | Sales or qualified leads defined the same way across the period | Finance and sales ops | 1 to 2 weeks |
| Controls logged | Price changes, promotions, stockouts and events on a calendar | Marketing ops | 1 to 3 weeks |
| Decision owner | Someone with authority to move budget each quarter | CMO or CFO | A meeting |
| Test capacity | Ability to run one geo or lift test per half year | Performance lead | Ongoing |
| Modeling skills | A data scientist with Python or R, or a certified partner | Analytics lead | Hire or contract |
Score one point per pass. With 7 or 8, start now. With 5 or 6, fix the gaps this quarter and model next quarter. With 4 or fewer, run incrementality tests and clean up tracking first. A martech stack audit often turns up the missing spend and KPI data.
Marketing Mix Modeling Example: How Output Changes a Budget Split
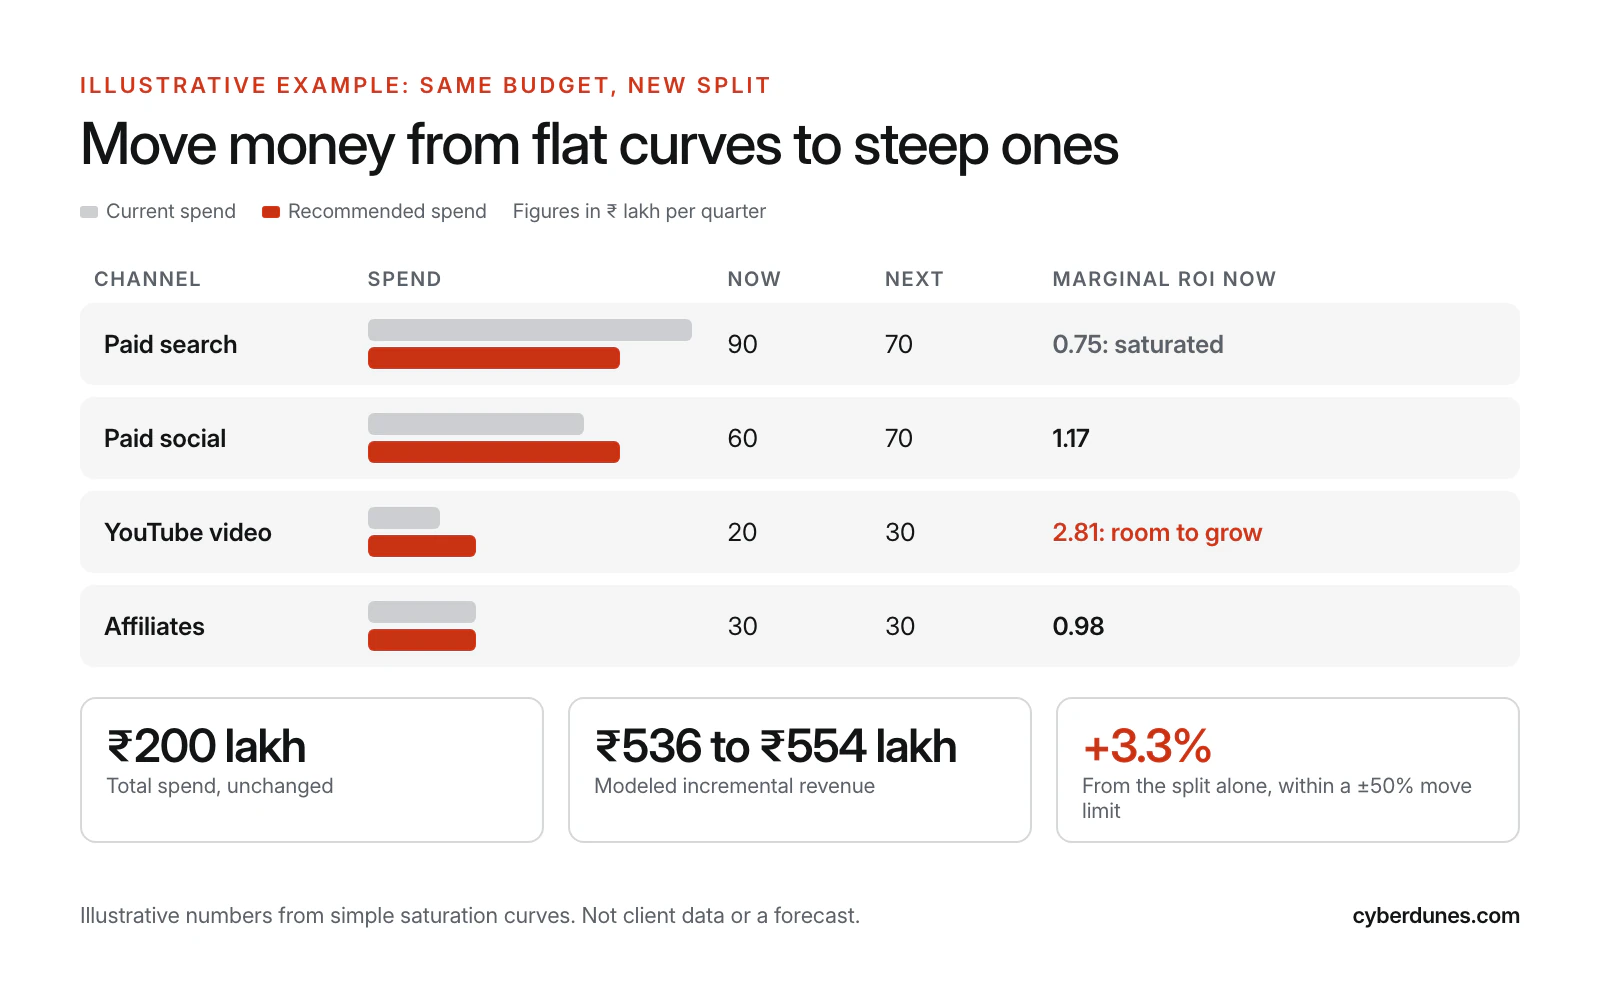
MMM output changes budgets through marginal ROI, the revenue the next rupee would add in each channel. Money should move from channels where marginal ROI is low to channels where it is high, until they even out. The example below is illustrative, built from simple saturation curves. It is not client data.
A brand spends ₹200 lakh a quarter across four channels. Its model returns these estimates:
| Channel | Spend (₹ lakh) | Modeled revenue (₹ lakh) | Average ROI | Marginal ROI |
|---|---|---|---|---|
| Paid search | 90 | 270.0 | 3.00 | 0.75 |
| Paid social | 60 | 140.0 | 2.33 | 1.17 |
| YouTube video | 20 | 75.0 | 3.75 | 2.81 |
| Affiliates | 30 | 51.4 | 1.71 | 0.98 |
| Total | 200 | 536.4 | 2.68 |
Paid search has a strong average ROI of 3.00, which is why last-click reports love it. But its marginal ROI is 0.75: the last ₹1 lakh brings back only ₹0.75 lakh. YouTube's next ₹1 lakh brings back ₹2.81 lakh. We cap any channel's move at 50% per quarter, because the model has not seen spend outside its historical range. With that cap, the optimizer moves ₹20 lakh out of search, ₹10 lakh into social and ₹10 lakh into YouTube.
- Paid search: 90 to 70, revenue 270.0 to 252.0
- Paid social: 60 to 70, revenue 140.0 to 150.8
- YouTube video: 20 to 30, revenue 75.0 to 100.0
- Affiliates: unchanged at 30, revenue 51.4
Modeled revenue rises from ₹536.4 lakh to ₹554.2 lakh, a gain of ₹17.8 lakh or 3.3%, with the same budget. YouTube's marginal ROI is still the highest after the move, at 2.22. The next step is a geo test that raises YouTube spend further in a few regions. That confirms the curve before the next quarter's shift.
For more ways to cut waste before you model, see our five ways to save money on your marketing budget.
What Does MMM Cost in Team and Time?
The software is free; the cost is people. In our planning, a first Meridian model for a mid-size brand takes about three months. The roles below are our estimate, not a vendor quote.
- Data scientist or certified partner: builds, checks and refreshes the model. This is the critical skill.
- Data engineer or analyst: pulls and reconciles spend, KPI and control data. Expect this to take most of the first month.
- Finance partner: confirms that spend and revenue match the books, which gives the output credibility.
- Marketing owner: supplies context on promotions and creative changes, and acts on the result.
For ongoing cost, Meridian's refresh guidance suggests updating "quarterly, annually, or at a frequency that matches your marketing budget decision making process." To make results usable by non-coders, Meridian's Scenario Planner turns a trained model into a report with interactive budget scenarios.
Where Do MMM Projects Go Wrong?
Most failures come from the data and from decisions, not from the algorithm. These are the ones we see most often in budget reviews:
- No spend variation. If a channel ran at the same level every week, the model cannot tell what it does. Plan some variation in advance.
- Promotions left out. A sale that coincides with a media burst gets credited to the media.
- Search modeled as if it creates demand. Branded search partly captures demand that other channels created. Include brand search volume as a control, as Meridian advises.
- Average ROI read as a decision. Budgets should follow marginal ROI.
- No experiments. An uncalibrated model is a well-argued opinion. Calibrate at least your largest channel.
- No one to act on it. A model without a quarterly budget meeting is a report nobody reads.
A 90-Day Plan to Your First Marketing Mix Model
- Days 1 to 15: decide and scope. Run the readiness checklist, name the decision owner, choose the KPI and pick Meridian or Robyn.
- Days 16 to 45: build the dataset. Gather weekly spend, impressions, KPI and controls. Reconcile spend to finance and log promotions and events.
- Days 30 to 60: launch one experiment. Run a geo test on your largest channel to calibrate the model.
- Days 46 to 75: model and validate. Fit, check model health and fit on held-out weeks, and set priors from experiments and domain knowledge.
- Days 76 to 90: decide. Present ROI, marginal ROI and two or three budget scenarios with move limits. Agree on the next quarter's split and the next test.
How Cyberdunes Helps Marketing Teams Measure What Works
MMM is only as good as the data and decisions around it. Our product management consulting team helps you define north star metrics and goals, and connect measurement to the OKRs your budget reviews use. Apex® connects your website to Google Analytics, your CRM and marketing automation through its API layer, as described in our integrations guide. That gives your model consistent KPI data to work from. For tracking foundations, start with our GA4 setup guide.
Talk to Us About Your Measurement Plan
Sources
- Meridian is now available to everyone, Google, January 2025
- Meridian, Google for Developers, accessed October 2026
- An introduction to Meridian, Google for Developers, July 2026
- Collect and organize your data, Google for Developers, accessed October 2026
- Amount of data needed, Google for Developers, accessed October 2026
- Media saturation and lagging, Google for Developers, July 2026
- Calibrate treatment priors, Google for Developers, accessed October 2026
- Refresh the model, Google for Developers, accessed October 2026
- Meridian Scenario Planner, Google for Developers, accessed October 2026
- Meridian FAQs, Google for Developers, accessed October 2026
- Robyn, Meta Marketing Science on GitHub, accessed October 2026
- Robyn features, Meta Marketing Science, accessed October 2026
- National models, Google for Developers, accessed October 2026
- User privacy and data use, Apple Developer, accessed October 2026
- Next steps for Privacy Sandbox and tracking protections in Chrome, Google, April 2025
- [GA4] Attribution models, Google Analytics Help, accessed October 2026