





AI visibility metrics are the numbers that show how often, how accurately and how favorably AI engines present your brand, and what that sends back to your site. Six cover it: prompt coverage, citation rate, share of voice, sentiment score, accuracy rate and referral traffic. Below are formulas, worked math and a board slide.
Key Takeaways
- Track six AI visibility metrics: prompt coverage, citation rate, share of voice, sentiment score, accuracy rate and AI referral traffic.
- AI share of voice = your brand mentions ÷ (your mentions + all tracked competitor mentions) × 100, measured on a fixed prompt set.
- Run every prompt several times per engine and report ranges, because AI answers vary from run to run.
- Citation rate and referral traffic connect to the website, so they belong on the same board slide as pipeline numbers.
- Report weekly to the working team, monthly to marketing leadership and quarterly to the board, always against a fixed baseline.
This guide is for CMOs, analytics leads and heads of growth who have to defend GEO (generative engine optimization) spend in a 2027 budget review. We work on AI visibility with brands through our GEO and page speed services and through Apex®, and one question keeps coming up: what do we report? The formulas here are Cyberdunes' proposed definitions, not an industry standard. We show the method so you can challenge it and adapt it.
Why Do You Need AI Visibility Metrics Now?
Because the pain is no longer getting a tool. It's getting a number your CFO believes. In September 2026, roundups such as Cybernews' list of AI visibility tools for marketing teams and Inquirer's five tools for tracking brand mentions, citations and traffic showed how crowded the tooling is. Every tool shows a dashboard. Few tell you which AI visibility metrics deserve a seat in the boardroom.
Here's our opinion: most dashboards lead with vanity numbers. A "visibility score" of 74 with no formula behind it is a mood, not a KPI. If you can't write the numerator and denominator on a whiteboard, don't put it in front of a board.
Which AI Visibility Metrics Matter?
Six metrics matter, and each answers a different executive question. Together they cover presence, authority, competitive position, reputation, correctness and business outcome.
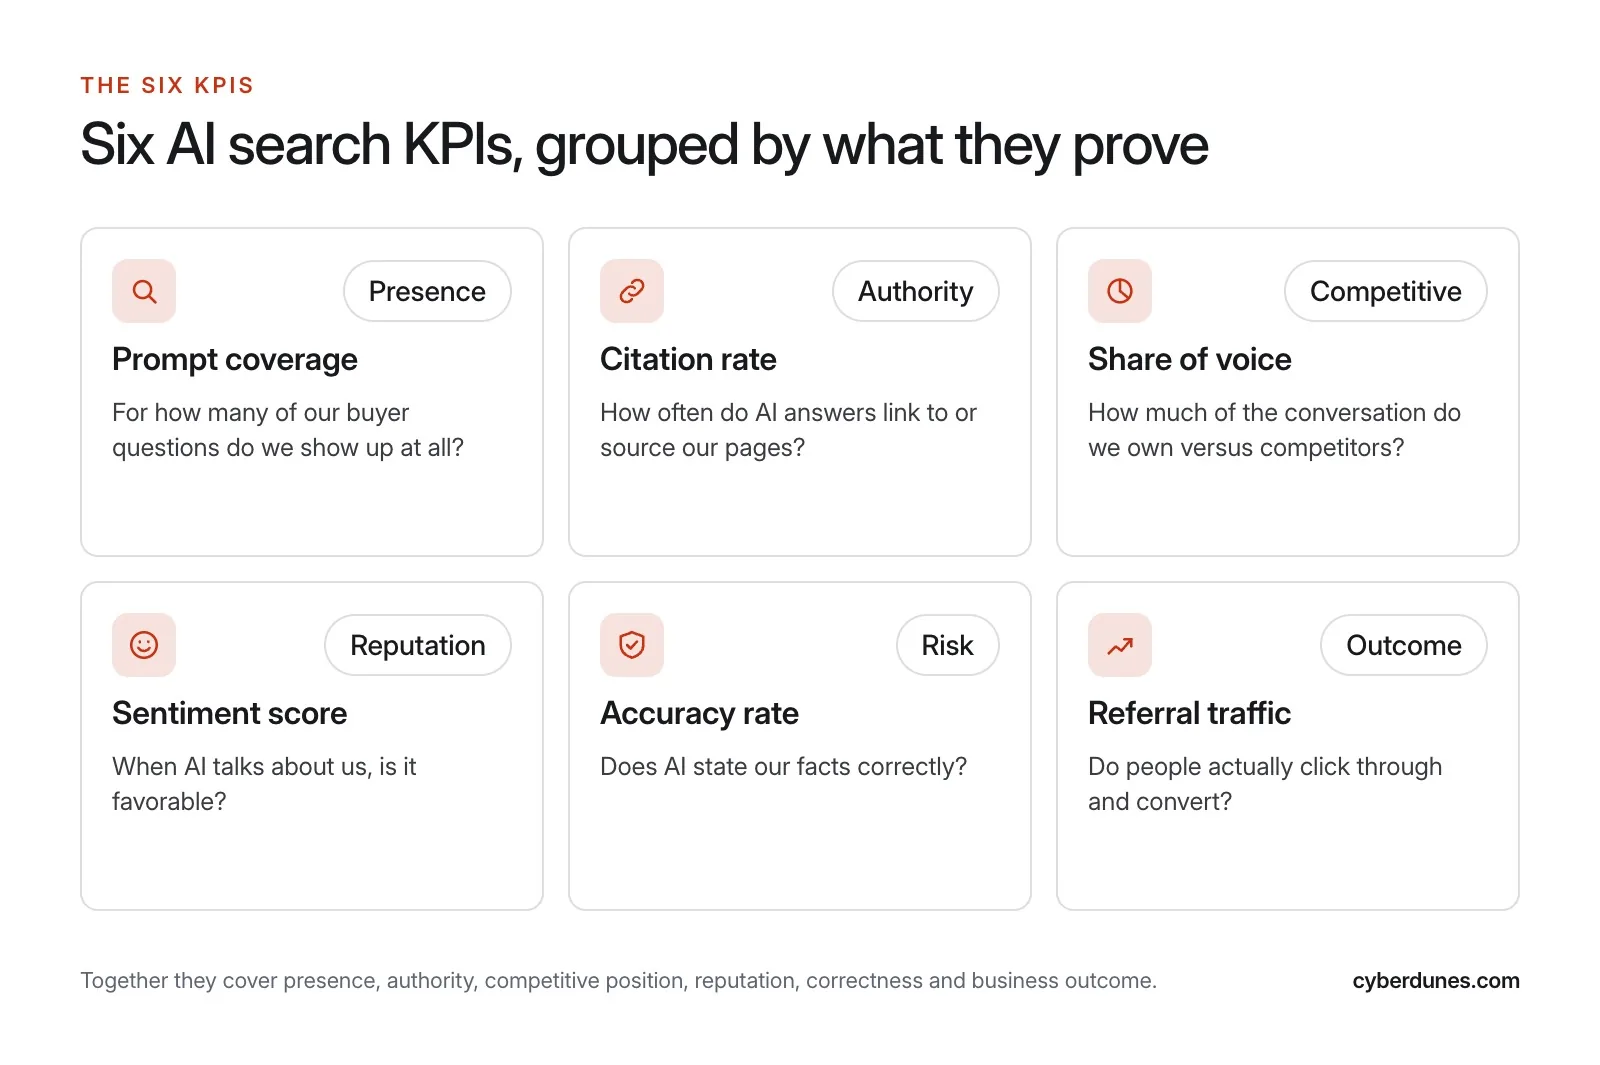
| KPI | Question it answers | Type |
|---|---|---|
| Prompt coverage | For how many of our buyer questions do we show up at all? | Presence |
| Citation rate | How often do AI answers link to or source our pages? | Authority |
| Share of voice | How much of the conversation do we own versus competitors? | Competitive |
| Sentiment score | When AI talks about us, is it favorable? | Reputation |
| Accuracy rate | Does AI state our facts correctly? | Risk |
| Referral traffic | Do people actually click through and convert? | Outcome |
Notice what's missing: "average position" or "rank in ChatGPT." AI answers aren't ranked lists with stable positions, so chasing position is a trap (more on that below). For the terms used here, our AI search and GEO glossary defines 26 of them.
How Do You Calculate Each of the AI Visibility Metrics?
Each metric is a simple ratio over a fixed prompt set. Fix the set, the engines and the number of runs first. Then every formula below becomes repeatable.
Set the Measurement Frame First
Before any formula, lock four things and write them down:
- Prompt set: 40 to 100 natural-language prompts a buyer would type, grouped by funnel stage and product line.
- Engines: ChatGPT, Gemini, Claude, Perplexity and Google AI Overviews.
- Runs: each prompt run several times per engine per cycle (we suggest at least 4).
- Competitor list: 3 to 6 named rivals, frozen for the quarter.
If you change any of these mid-quarter, your trend line is meaningless. So if you must change them, restate the baseline.
The AI Visibility Metrics Formula Table
| KPI | Formula (proposed definition) | Data source | Owner |
|---|---|---|---|
| Prompt coverage | Prompts where your brand appears in at least 30% of runs ÷ total tracked prompts × 100 | Prompt tracking | SEO/GEO lead |
| Citation rate | Answers that cite a URL on your domain ÷ total answers run × 100 | Prompt tracking | Content lead |
| AI share of voice | Your brand mentions ÷ (your mentions + all tracked competitor mentions) × 100 | Prompt tracking | CMO or brand lead |
| Sentiment score | (Positive mentions − negative mentions) ÷ total mentions of your brand × 100, range −100 to +100 | Prompt tracking plus manual review | Brand lead |
| Accuracy rate | Mentions with all checked facts correct ÷ total mentions × 100 | Fact sheet audit | Product marketing |
| AI referral traffic | Sessions from AI sources; also AI sessions ÷ total sessions × 100, and conversion rate of those sessions | Web analytics | Analytics lead |
The 30% threshold in prompt coverage is our judgment call. It filters out one-off lucky appearances. Pick your own threshold, but pick it once.
What Is Citation Rate in AI Search?
Citation rate in AI search is the share of AI answers that link to or name a page on your domain as a source. It's different from a mention. An engine can talk about your brand without citing you, and it can cite your page while naming a competitor in the text. So track both. A gap between share of voice and citation rate tells you whether your problem is awareness or content structure.
How Do You Calculate AI Share of Voice?
Count brand mentions across all runs for your prompt set, then divide yours by the total for you and your named competitors. Count each brand once per answer, not once per sentence, or long answers will skew the result. Keep the competitor list fixed, because adding a rival to the denominator lowers your share even though nothing changed in the market.
Reading Sentiment and Accuracy Together
Sentiment tells you how AI feels about you. Accuracy tells you whether it's right. They can disagree. A glowing answer that quotes last year's pricing or the wrong service area is favorable but inaccurate, and it's the one that costs you a sale. For example, build a fact sheet of 8 to 12 checkable facts (founding year, locations, services, plans, certifications) and score every mention against it.
What Does a Worked Example Look Like?
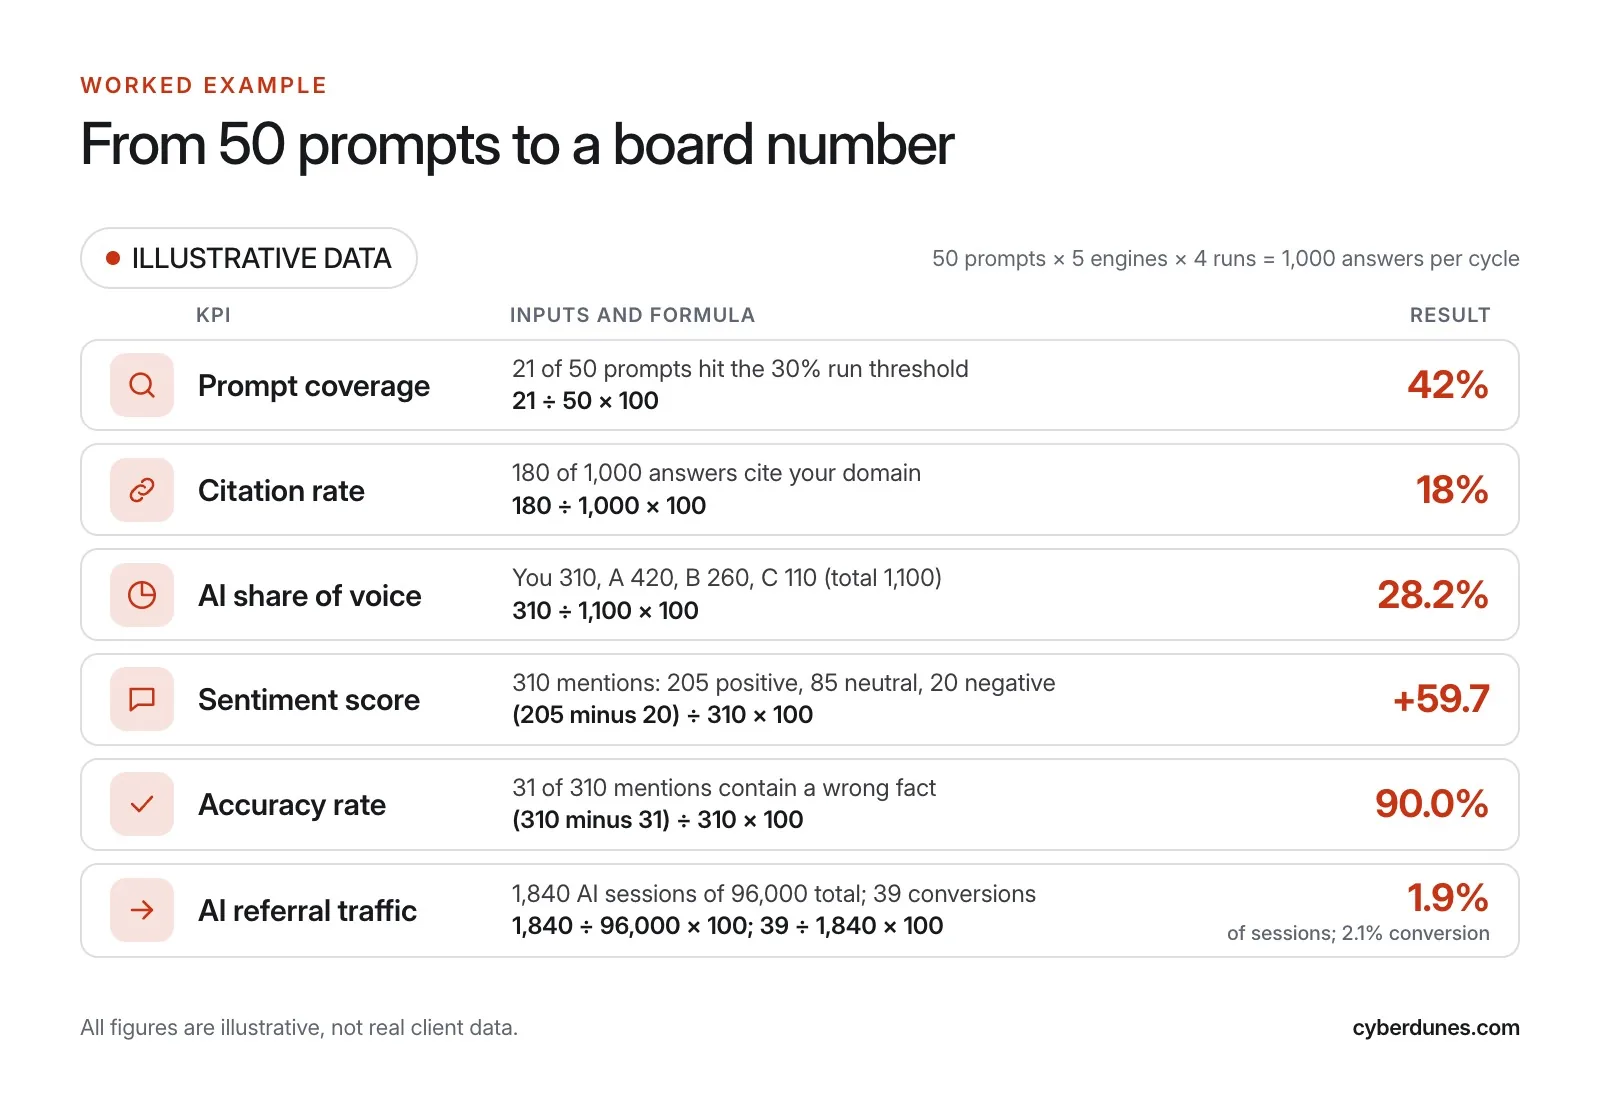
Here is an illustrative example with made-up numbers, so you can see the math for each of the AI visibility metrics end to end. Assume 50 prompts, 5 engines and 4 runs per engine, which gives 50 × 5 × 4 = 1,000 answers per cycle. None of these figures are real client data.
| KPI | Inputs (illustrative) | Calculation | Result |
|---|---|---|---|
| Prompt coverage | 21 of 50 prompts hit the 30% run threshold | 21 ÷ 50 × 100 | 42% |
| Citation rate | 180 of 1,000 answers cite your domain | 180 ÷ 1,000 × 100 | 18% |
| AI share of voice | You 310, Competitor A 420, B 260, C 110 (total 1,100) | 310 ÷ 1,100 × 100 | 28.2% |
| Sentiment score | 310 mentions: 205 positive, 85 neutral, 20 negative | (205 − 20) ÷ 310 × 100 | +59.7 |
| Accuracy rate | 31 of 310 mentions contain a wrong fact | (310 − 31) ÷ 310 × 100 | 90.0% |
| AI referral traffic | 1,840 AI sessions of 96,000 total; 39 conversions | 1,840 ÷ 96,000 × 100; 39 ÷ 1,840 × 100 | 1.9% of sessions; 2.1% conversion |
What would you tell the board? Something like: "We're present on 42% of buyer questions, own 28% of the conversation against three rivals, are cited in 18% of answers and get facts wrong in one mention out of ten. AI sends under 2% of sessions, but they convert at 2.1%." That's a story with a next action. Fix the 10% inaccuracy, then lift citations on the 29 prompts where you're absent.
Can AI Traffic Be Tracked in Analytics?
Partly. You can track the visits that arrive with a referrer, but some AI traffic lands in Direct. So treat your AI referral number as a floor, not a total.
Here are the steps we use:
- In Google Analytics 4, create a custom channel group for AI sources (for example chatgpt.com, perplexity.ai, gemini.google.com, claude.ai) and place it above Referral.
- Check your traffic acquisition report to see where each source actually lands before you trust the grouping.
- Pair sessions with conversions, not just visits. Volume is small, so quality is the argument.
- For Google's own AI features, use Search Console. Google's documentation on AI features says AI Overviews and AI Mode traffic is counted in the Web search type of the Performance report. In June 2026, Google also introduced Search Generative AI performance reports with dedicated views of impressions in these features.
Watch for the reverse problem too. When AI answers satisfy the user, the visit never happens. Our piece on zero-click searches covers how to read falling clicks alongside rising mentions. The conversion rate optimization fixes for AI search traffic show how to make the few visits count.
How Should You Report AI Visibility Metrics Upward?
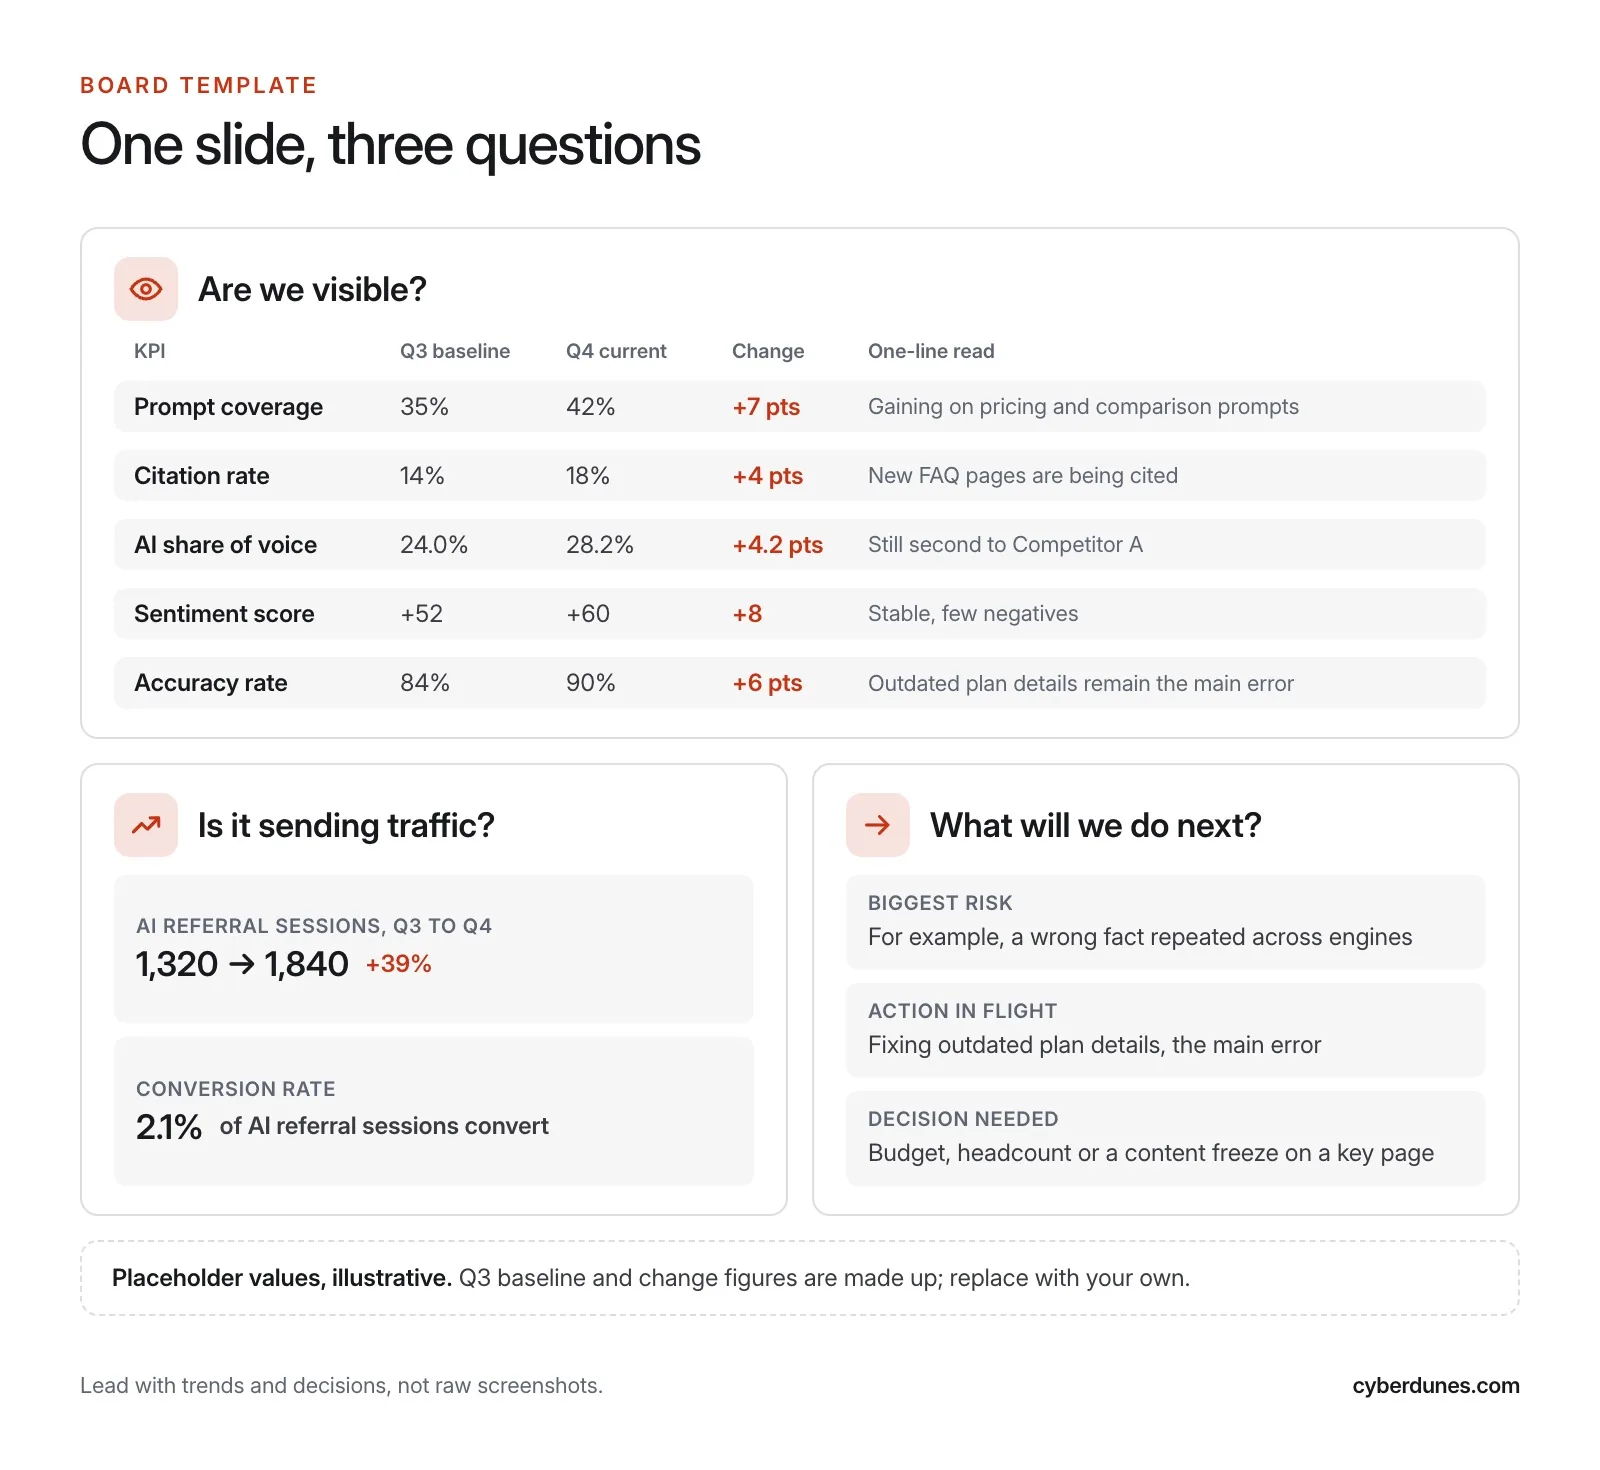
Use one slide with six numbers, a trend against baseline, one risk and one ask. Boards read direction and decisions, not methodology, so keep the formulas in an appendix.
Sample Board Slide
This is an illustrative layout for a quarterly AI visibility dashboard. Numbers match the worked example above, but the baseline and change columns are made up.
| KPI | Q3 baseline (illustrative) | Q4 current | Change | One-line read |
|---|---|---|---|---|
| Prompt coverage | 35% | 42% | +7 pts | Gaining on pricing and comparison prompts |
| Citation rate | 14% | 18% | +4 pts | New FAQ pages are being cited |
| AI share of voice | 24.0% | 28.2% | +4.2 pts | Still second to Competitor A |
| Sentiment score | +52 | +60 | +8 | Stable, few negatives |
| Accuracy rate | 84% | 90% | +6 pts | Outdated plan details remain the main error |
| AI referral sessions | 1,320 | 1,840 | +39% | Converts at 2.1% |
Under the table, add three lines: the biggest risk (for example, a wrong fact repeated across engines), the action in flight, and the decision you need (budget, headcount or a content freeze on a key page).
Reporting Cadence for AI Visibility Metrics
| Audience | Cadence | What they see |
|---|---|---|
| GEO and content team | Weekly | Prompt-level wins and losses, new errors, pages to fix |
| Marketing leadership | Monthly | All six KPIs with ranges and competitor movement |
| Board or exec committee | Quarterly | One slide, trend against baseline, risk and ask |
Our reporting tips: show ranges rather than single points, annotate every site change on the trend line, and never swap the prompt set between quarters without restating the baseline. Pair this with your classic search numbers too. Our complete guide to GEO explains how the two connect.
What Are the Common Measurement Traps?
The biggest trap is treating one AI answer as a data point. AI answers change from run to run, so single snapshots mislead. Sample enough, and report uncertainty.
Sampling and Variance
In a January 2026 study covered by Search Engine Journal, SparkToro's research found that AI tools rarely return the same brand list twice for the same prompt. The authors listed their own limits: the study isn't peer reviewed and used default tool settings. Still, the direction matches what practitioners see. Variance is real.
Here's a rough sense of the noise. If your citation rate is 18% across 1,000 answers, the sampling margin at 95% confidence is about ±2.4 percentage points (1.96 × √(0.18 × 0.82 ÷ 1,000)). That math assumes independent answers. Repeated runs of the same prompt aren't fully independent, so treat ±2.4 as a minimum. In our example above, a 4-point gain in citation rate is a signal. A 1-point wiggle is not.
Seven Traps to Avoid
- Chasing rank. Position inside an AI answer isn't stable. Measure presence across many runs.
- One run per prompt. You're measuring luck. Run each prompt several times.
- A moving competitor list. It silently changes share of voice.
- Branded prompts only. They flatter you. Include category and problem prompts where buyers don't know your name.
- Counting mentions without reading them. A negative mention counts toward share of voice, so read sentiment alongside it.
- Personalization and location drift. Answers differ by account, region and language. Fix the setup and note it in your method.
- Attributing all growth to GEO. Brand campaigns, PR and seasonality move these numbers too. Say "correlated with" until you have a test.
Be honest with your CMO: these AI visibility metrics are directional, not audited. A good report says so up front. That candor is what makes the rest credible.
How Do You Roll This Out in 90 Days?
Start with the prompt set and baseline in the first month, then automate and report. Here's a plan with owners.
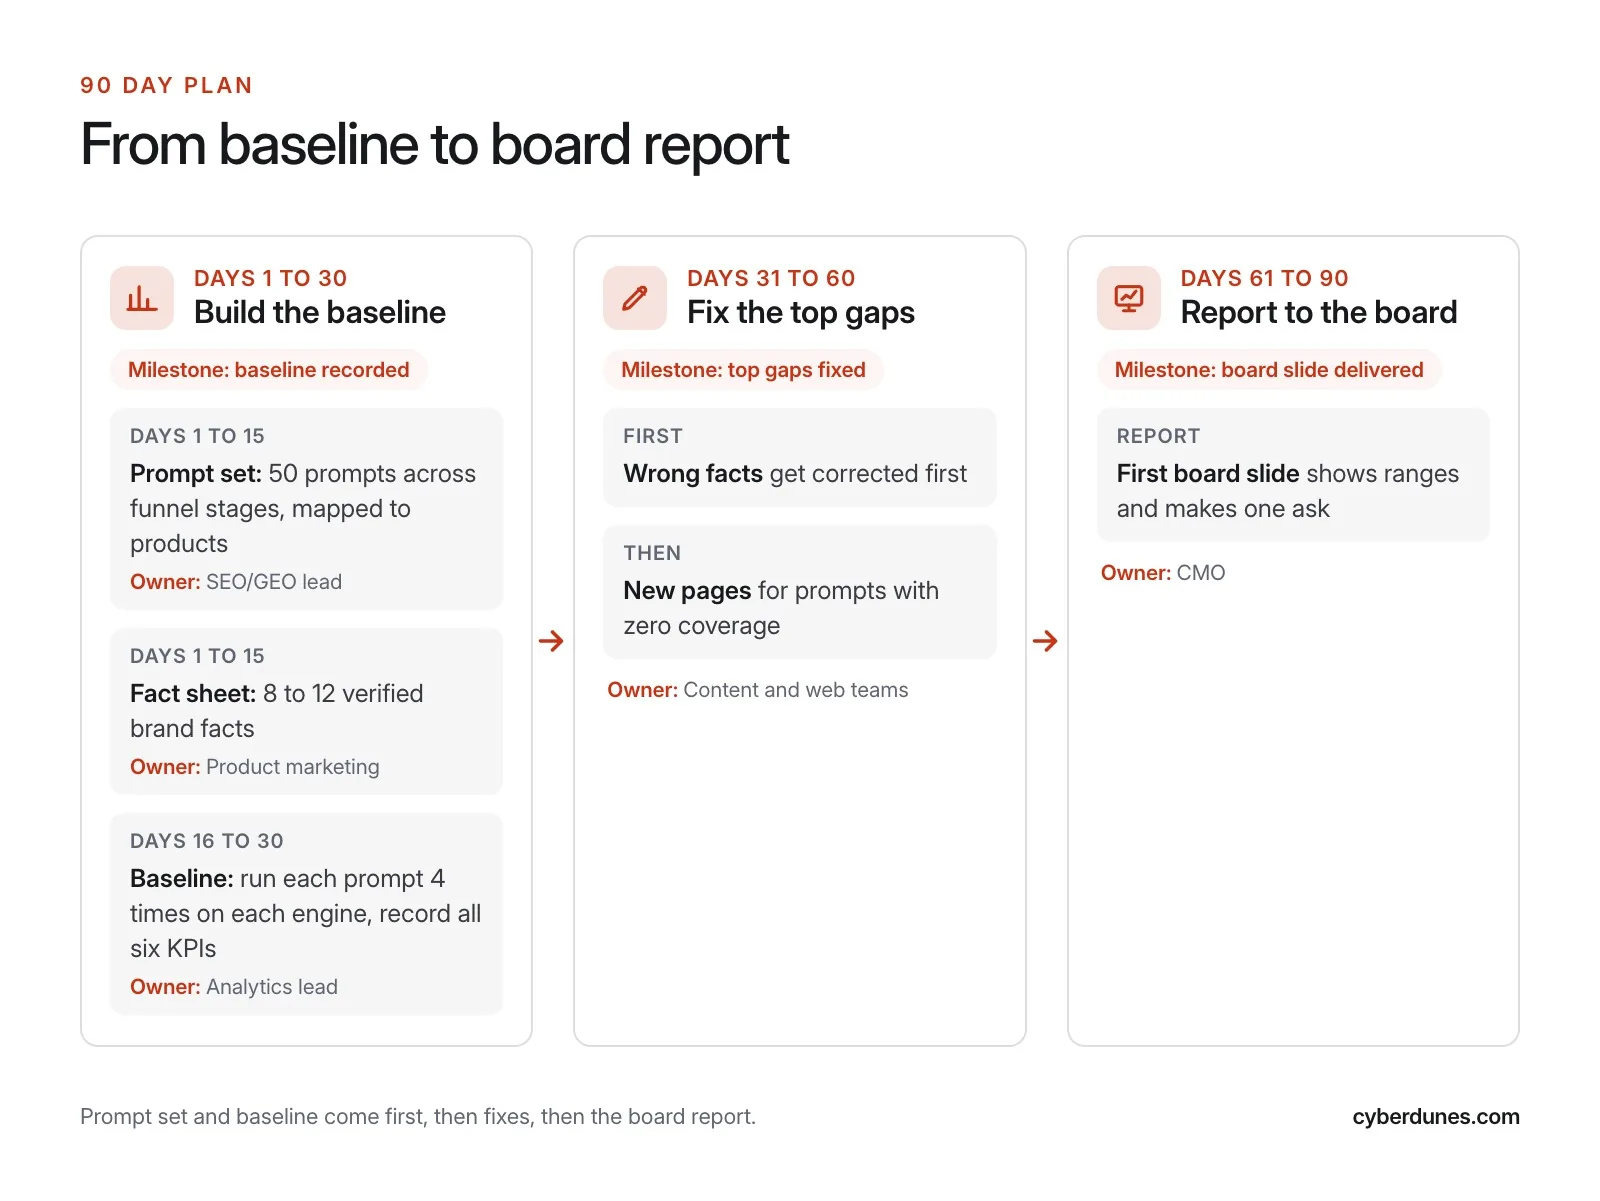
- Days 1 to 15, build the prompt set: 50 prompts across funnel stages, mapped to products. Owner: SEO/GEO lead.
- Days 1 to 15, write the fact sheet: 8 to 12 verified brand facts. Owner: product marketing.
- Days 16 to 30, take the baseline: run each prompt 4 times on each engine, then record all six KPIs. Owner: analytics lead.
- Days 31 to 60, fix the top gaps: wrong facts first, then pages for prompts with zero coverage. Owner: content and web teams.
- Days 61 to 90, report: first board slide with ranges and one ask. Owner: CMO.
If you only have time to start with one tool, our guide to the AI visibility checker shows what a first pass looks like. Teams with several locations can also read our multi-location local SEO playbook, because location data is a common source of accuracy errors.
How Cyberdunes and Apex® Help With AI Visibility Metrics
Apex®, the AI-native digital experience platform (DXP), tracks prompts, citations and sentiment across ChatGPT, Gemini, Claude, Perplexity and Google AI Overviews, and it sits in the same place you publish. So when a metric shows a gap, you can fix the page without carrying a report to a separate system. Apex® also connects to Google Analytics through its API layer, so referral traffic can sit next to your visibility numbers.
The formulas in this article work in a spreadsheet or in any tracker, so you don't need our platform to use them. If you want help setting the prompt set, baseline and board slide, our team does that as part of the GEO and page speed services. We can't promise citations or rankings. But we can make the measurement defensible.
Run a free AI visibility check
Talk to us about AI visibility reporting
Sources
- Best AI Visibility Tools for Marketing Teams in 2026 (Cybernews, September 2026)
- 5 AI visibility tools for tracking brand mentions, citations, and traffic (INQUIRER.net USA, September 2026)
- AI Features and Your Website (Google Search Central, 2025)
- Introducing Search Generative AI performance reports in Search Console (Google Search Central Blog, June 2026)
- AI Recommendations Change With Nearly Every Query: SparkToro (Search Engine Journal, January 2026)
- NEW Research: AIs are highly inconsistent when recommending brands or products; marketers should take care when tracking AI visibility, SparkToro, January 2026
- Custom channel groups - Analytics Help, Google, 2026