






Web Analytics Basics
Data you cannot read will not improve your site. Set up Google Analytics correctly and learn what core metrics such as bounce rate and exit rate really mean.
- 5
- Articles
- 10
- Categories
- 532,225
- Readers

Marketing Mix Modeling: A Practical Guide to Google Meridian
Marketing mix modeling explained: how MMM and Google Meridian work, the data you need, MMM vs attribution, a readiness checklist and a worked budget example.Read Article
How to Track AI Traffic in GA4: Channels, Regex and Reports
Track AI traffic in GA4 with the AI Assistant channel, a custom channel group regex and a reporting template, plus what GA4 cannot see and how to fill it.Read Article
Bounce Rate vs Exit Rate: The Difference in Google Analytics
Learn the difference between bounce rate and exit rate in Google Analytics 4, how GA4 ties bounce rate to engagement rate, and practical ways to reduce both.Read Article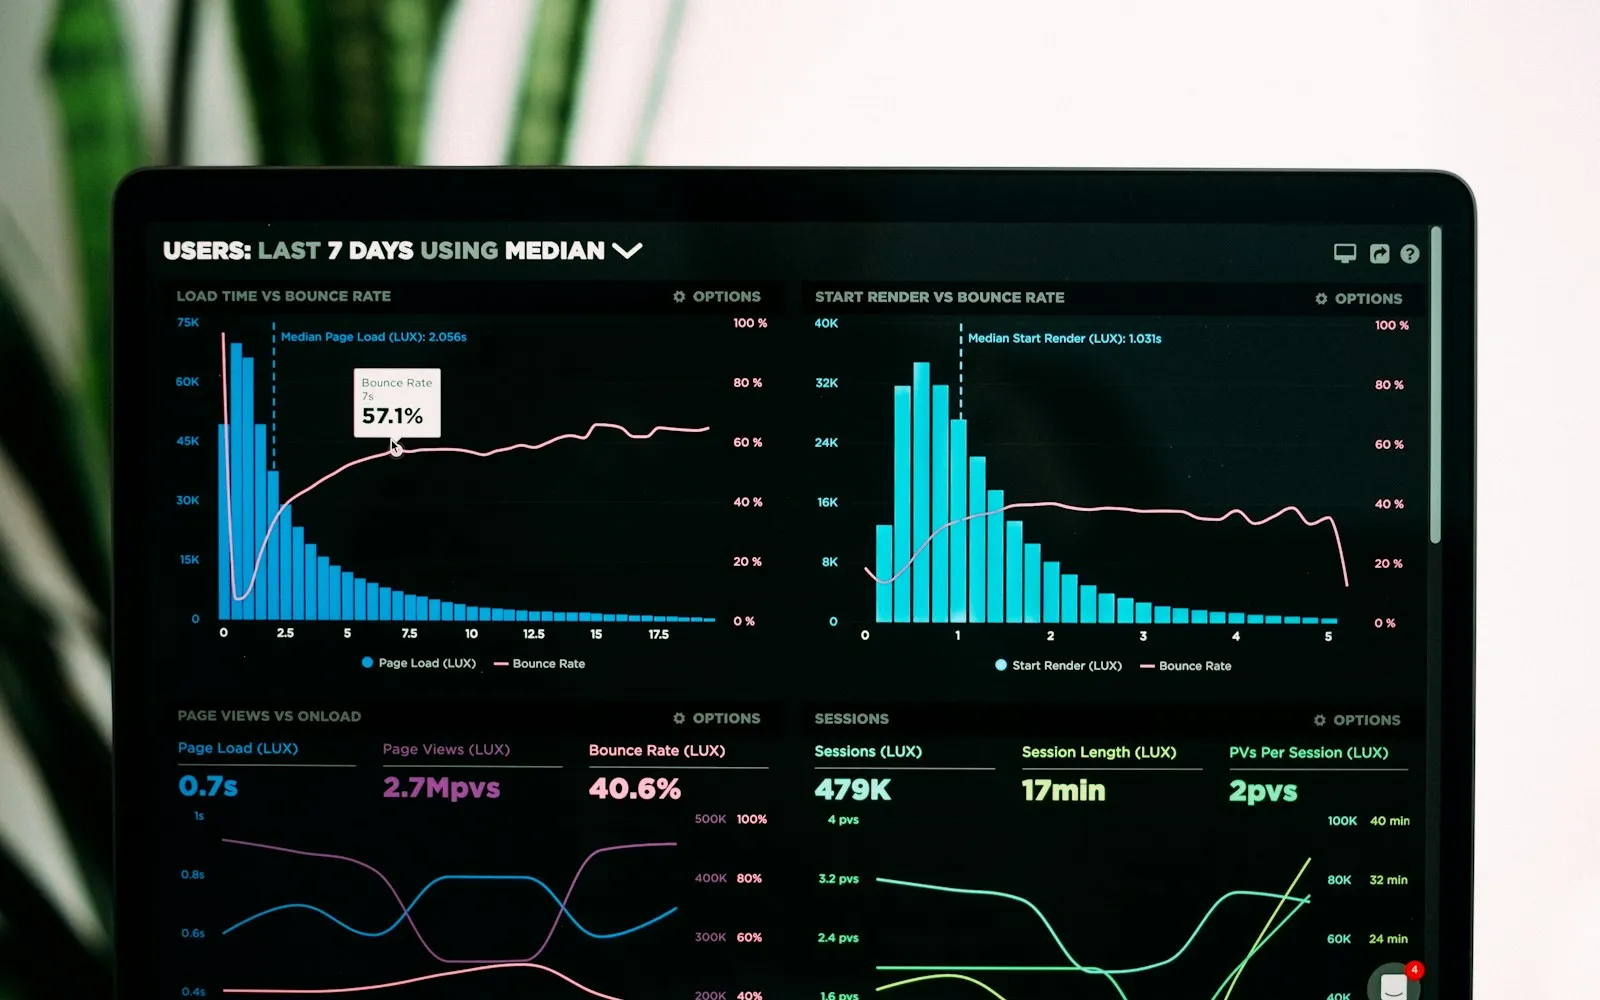
Google Analytics 4 Setup: A Step-By-Step Guide
Set up Google Analytics 4 with Google Tag Manager step by step: create a property and data stream, add the Google tag, mark key events and link Search Console.Read ArticleFAQs
Questions, Answered
Can’t find what you’re looking for? Our team is happy to help.
What will I find in the Cyberdunes analytics guides?
The Cyberdunes analytics guides cover the essential steps for setting up Google Analytics correctly and explain the difference between bounce rate and exit rate. Together they help marketers collect data they can trust and understand what core website metrics are really telling them.
What is web analytics?
Web analytics is the collection, measurement and analysis of data about how people find and use a website. It shows where visitors come from, which pages they view, how engaged they are and whether they complete goals such as sign-ups or purchases, so teams can improve the site with evidence.
Why does a correct Google Analytics setup matter?
A correct Google Analytics setup matters because a misconfigured property produces numbers you cannot trust. Missing tags, duplicate tracking or unfiltered internal traffic can distort metrics like conversions and bounce rate, leading teams to make decisions based on misleading data.
What is Google Analytics 4?
Google Analytics 4, or GA4, is the current version of Google Analytics. It replaced Universal Analytics, which stopped processing data in July 2023. GA4 measures activity as events and sessions, and it changed how some metrics work, including bounce rate, which is now tied to engagement rate.
What is the difference between bounce rate and exit rate?
In GA4, bounce rate is the share of sessions that were not engaged, so it describes the quality of a whole visit. Exit rate shows how often a page was the last one viewed in a session, so it describes where visits end. Each metric points to a different kind of problem.
Which website metrics should beginners track first?
Beginners should start with a small set of metrics: sessions by traffic source, engagement rate, conversions or key events, and the top landing pages. Splitting these by device and source shows where visitors come from and which pages turn them into leads, without drowning the team in reports.
What are key events in GA4?
Key events in GA4 are the actions you mark as important to your business, such as a form submission, sign-up or purchase. Marking them lets GA4 report on conversions, and a session that includes a key event counts as engaged even if it is short.
What are common Google Analytics mistakes?
Common Google Analytics mistakes include installing the tag twice, not marking key events, counting internal team visits as customer traffic, and comparing old Universal Analytics reports directly with GA4 data. Each one skews metrics, so check the setup before relying on the numbers.
How often should I review my website analytics?
Review core website analytics at least monthly, comparing results with your own past performance by device and traffic source. A regular rhythm makes trends easy to spot, while checking campaign or launch pages more often helps you catch problems quickly.
How can analytics help improve conversions?
Analytics helps improve conversions by showing which pages get the most entries, where visitors drop off and which traffic sources bring engaged users. Teams can then fix the pages with the biggest leaks first and measure whether each change made a difference.
Ideas Into Action